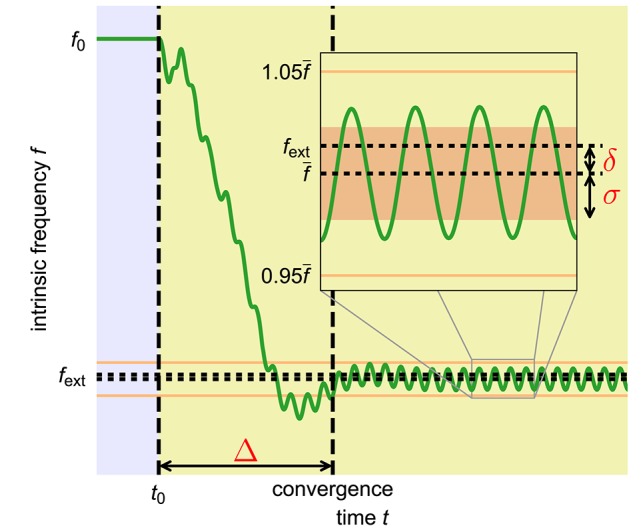
Figure 3.

Quantitative measures to capture the quality of an adaptation process. Shown is the time course of the intrinsic frequency of an adaptive frequency oscillator during the adaptation to an external periodic signal with high coupling constant ϵ and high learning rate η. The yellow shaded area indicates the time during which the external signal is applied. The inset shows a close up of the data in the indicated area. We introduce three measures to quantify the quality of a given frequency adaption process. The convergence time Δ is the time interval between the onset of the external signal at time t0 and the last deviation of the intrinsic frequency of the oscillator of more than 5% (orange horizontal lines) from the finally reached average intrinsic frequency . The frequency offset δ measures the difference between the final average intrinsic frequency and the target frequency of the external signal fext. In order to also capture the periodic fluctuations of the intrinsic frequency from the average value , we additionally introduce the final frequency fluctuation σ given by the standard deviation of the oscillations of the intrinsic frequency f in the finally reached state (area shaded in light red in the inset). The shown time course of the intrinsic frequency is taken from an adaptive frequency Hopf oscillator with μ = 1.0, ϵ = 5.0, η = 5.0, and f0 = 2.0 adapting to an external unit sine-wave signal with frequency fext = 1.0.
