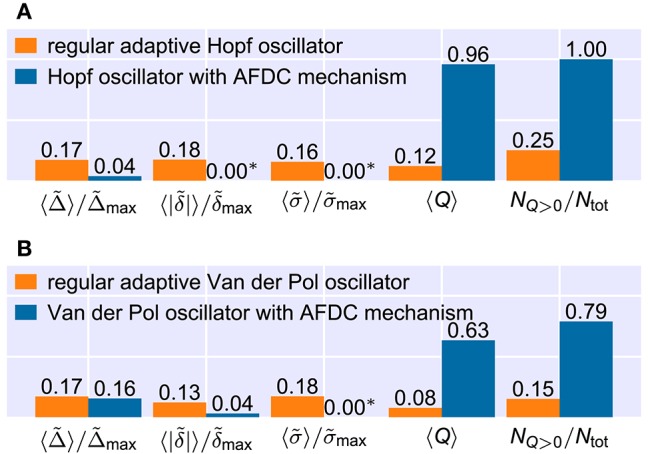
Figure 9.

Comparison of the frequency space averaged adaptation quality measures for the best found configurations of the regular adaptive oscillators and the respective oscillators with AFDC mechanism. Note that the averages of the relative convergence time , the final frequency offset and the relative final frequency fluctuation include only values from (f0, fext)-frequency pairs in which the combined quality measure Q has a nonzero value. The ratio of the number NQ>0 of (f0, fext)-pairs for which the quality Q has a nonzero value and the total number Ntot of frequency pairs is shown on the very right. All numbers are rounded. See methods for the used parameter values. (A) For the Hopf oscillator, all parameters are identical to the ones used in Figures 7, 8. (B) For the Van der Pol oscillator, we adapt the maximal allowed values of the quality measures. We use , and . In addition, we calculate and directly from the frequency determining variable θ and consider the last deviation of θ of more than 10% from the finally reached mean value to determine the adaptation time Δ. (*) Values shown as 0.00 are too small to be resolved in the figure. For the Hopf oscillator with AFDC mechanism, we find and . For the Van der Pol oscillator with AFDC mechanism, the average normalized final frequency fluctuation is .
