
Figure 8.
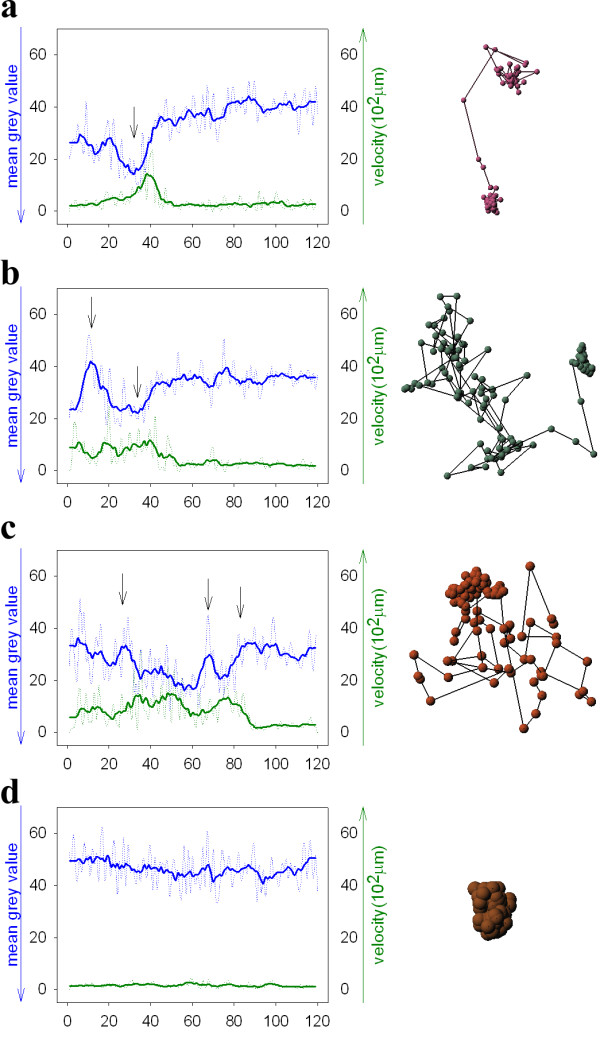
Correlation plots between mean grey values (green line) of chromatin densities and particle velocity (blue line) over a time range of 20 minutes. Arrows indicate significant changes in intensity and particle velocity. Red: NLS-GFP-vimentin; green: Hoechst 33342 stain.