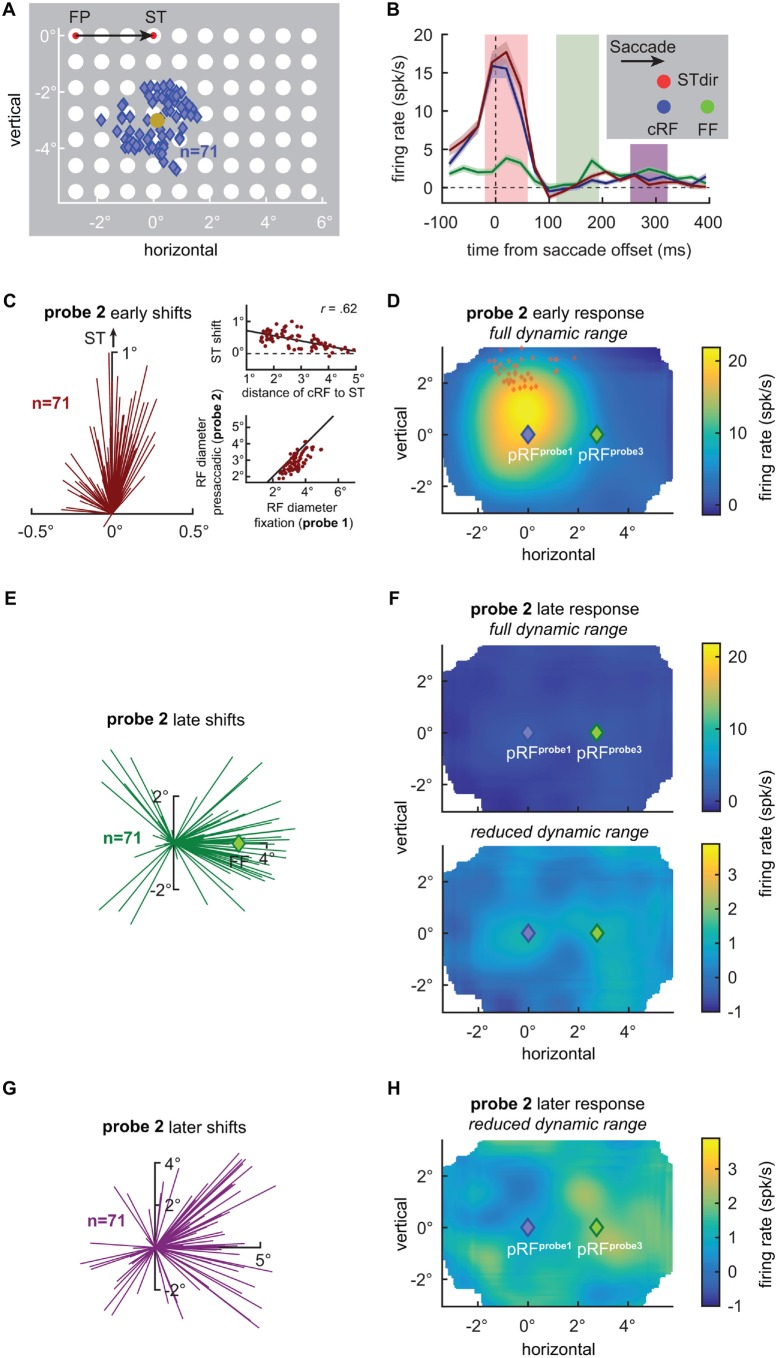
Figure 1.
V4 receptive field shifts at the time of saccades. (A) Centers of 71 V4 current receptive fields (cRFs) plotted together with the visual probe grid (white disks) drawn to scale. Responses of V4 neurons were probed during fixation at the fixation point (FP) or the saccade target (ST; red disks), long before and after an eye movement, or shortly before an eye movement from the FP to the ST. RFs were then estimated for each condition by fitting Gaussian functions at various times to the neuronal responses recorded in the three conditions. Blue diamonds indicate the centers of the estimated cRFs during fixation at the FP long before and after an eye movement (see “Materials and Methods” Section for details). The average cRF center was x = 0.15° and y = −3.07° (gold disk) relative to the ST (x = 0°, y = 0°). (B) Mean responses of the recorded V4 population to three probes flashed briefly before the onset of a saccade (probe 2). The blue line shows the mean response to a probe (blue disk) presented closest to the centers of the individual cRFs. The red line shows the mean response to a probe (red disk) presented 0.9° above the probe closest to the cRF, closer to the ST (STdir). The green line shows the mean response to a probe (green disk) presented closest to the centers of the estimated future fields (FFs). (C) RF shift estimates based on the immediate, early presaccadic probe responses (red shaded area in B). Each line indicates the difference between the center of the cRF (x = 0°, y = 0°), as measured long before an eye movement, and the center of the RF, as measured shortly before movement onset (alignment as in Tolias et al., 2001). Consistent with Tolias et al. (2001), V4 RF centers shifted towards the ST (see also Figure 2I). The amplitude of the RF shift towards the ST depended on the distance of the cRF center to the ST (upper inset). Solid line depicts best linear fit. Furthermore, consistent with Tolias et al. (2001) V4 RFs shrank by relative to their cRF size (lower inset). Solid line depicts line of unity. (D) Average population RF (pRF) based on the early visually evoked activity relative to saccade offset, as measured shortly before a saccade (probe 2) during fixation at the FP (see “Materials and Methods” Section for details). Full dynamic range of responses is shown. Consistent with individual RFs (C), the average RF shifts upwards, away from the current population RF (pRF) center as measured during fixation (probe 1; blue diamond; Figure 2A) and towards the STs (red diamonds; see also Figure 2I). (E) RF shift estimates based on the late, post-movement activity of presaccadic probe responses (green shaded area in B). RF centers shift in the direction of the FF (green diamond at x = 2.76°) consistent with Neupane et al. (2016a,b); see also Figure 2J. (F) Average pRF based on the late activity relative to saccade offset. The full dynamic range of responses is shown in the top panel. The bottom panel shows a strongly reduced dynamic range. Consistent with individual RFs (E), the average RF shifts rightwards, away from the pRF center as measured during fixation (probe 1; blue diamond) and towards the FF. (G) RF shift estimates based on the later, post-movement activity of presaccadic probe responses (purple shaded area in B). Each line indicates the difference between the center of the cRF (x = 0°, y = 0°), as probed (probe 1) long before an eye movement during fixation at the FP, and the center of the RF as probed (probe 2) shortly before movement onset. RF centers shift into the direction of the FF (x = 2.76°, y = 0°; see also Figure 2K). (H) Average pRF based on the later activity relative to saccade offset. Reduced dynamic range of responses is shown. The activity is still biased to the right, resembling the activity pattern shown in Figure 2B.

