Figure 6.
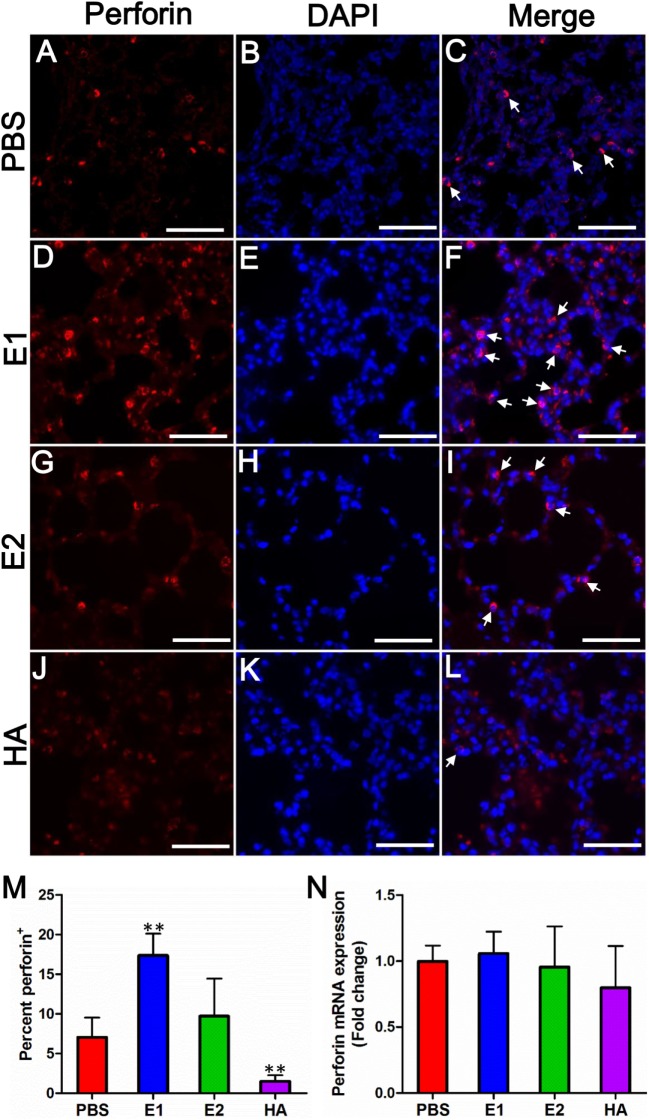
E1-vaccinated mice express perforin at a higher level than that of PBS-, E2-, or HA-vaccinated mice upon influenza virus infection. Perforin expression (red) from mouse lung tissues on day 5 post-inoculation was immunolabeled with rat anti-mouse perforin followed by goat anti-rat Alexa 594 (A–L). Nuclei were labeled by DAPI (blue). The white arrows indicate site of perforin expressing. Scale bars represent 20 μm. (M) Quantification of the percentage of perforin protein expression of each group. % = (perforin positive cell/total cells) × 100 (**P < 0.01). (N) Quantitative real time RT-PCR comparing perforin mRNA expression levels from mouse lung tissues on day 5 post-inoculation. Data are shown as fold change compared to the perforin mRNA expression level of the PBS group. The results represent mean values ± SD (n = 5).

