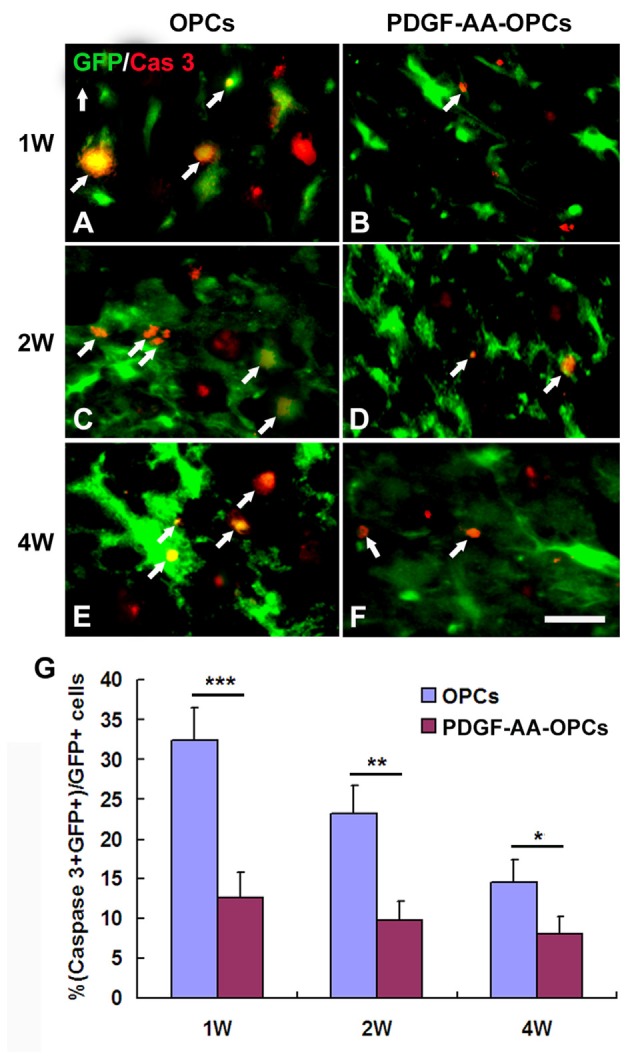
Figure 3.

Survival of OPCs in the injured spinal cord after transplantation, as determined by activated caspase-3 staining. (A–F) Representative photomicrographs showing caspase-3+ cells (red) co-localized with green fluorescent protein (GFP+) OPCs (green) in the spinal cord of rats that received transplantation of OPCs with or without PDGF-AA overexpression at 1, 2, or 4 weeks. (G) Quantitative analysis of activated caspase-3+ cells. There were fewer caspase-3+ GFP+ cells in the PDGF-AA-overexpressing OPC transplantation group than in the OPC transplantation groups. Data represent mean ± SD (n = 10). *P < 0.05, **P < 0.01, ***P < 0.001. Scale bar = 25 μm.
