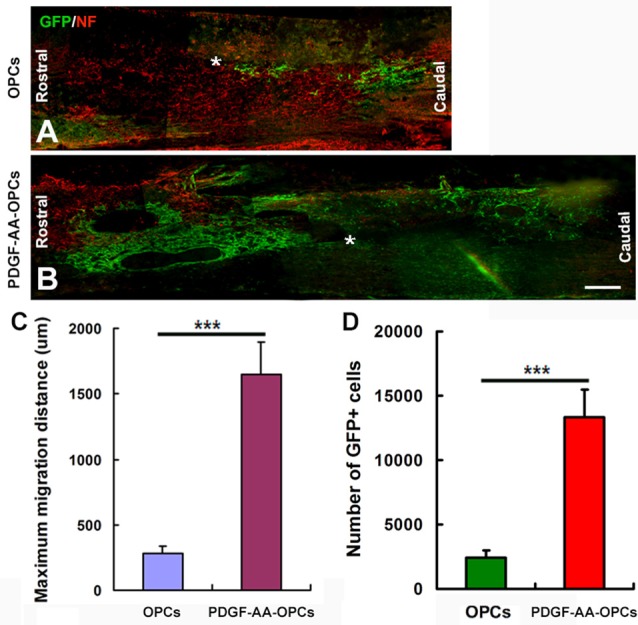
Figure 5.

Migration of transplanted OPCs in the spinal cord after transplantation. (A–D) Representative longitudinal sections showing the migration of transplanted OPCs over longer distances from the injury center (*) when overexpressing PDGF-AA as compared to those without PDGF-AA overexpression at 7 weeks. Data represent mean ± SD (n = 5). ***P < 0.001. Scale bar = 500 μm.
