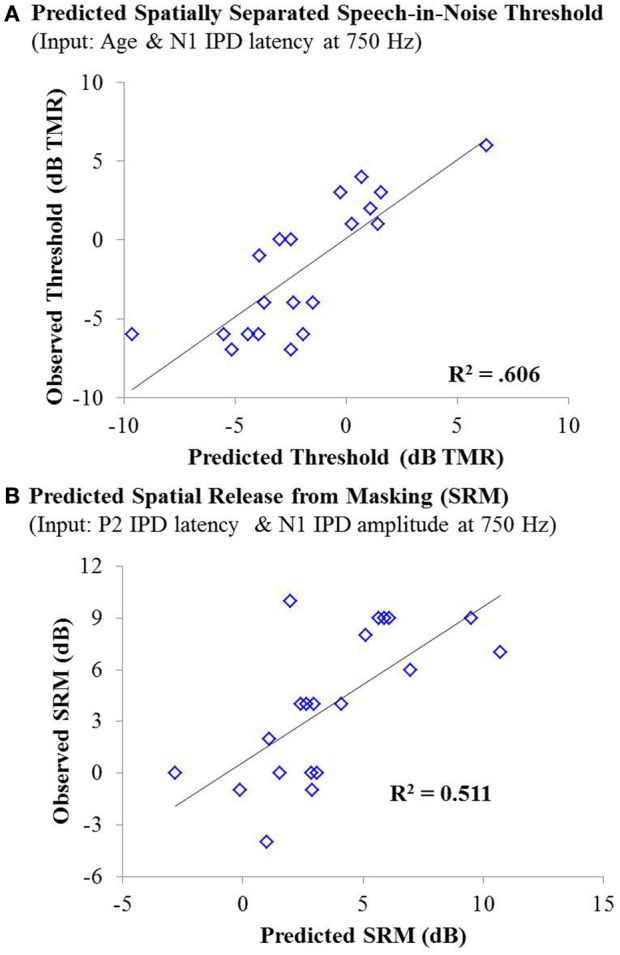
Figure 10.

(A) Individual thresholds measured in the spatially separated speech-in-noise condition for participants in experiment #2 plotted as a function of thresholds predicted by a linear regression model based on participant age and the latency of the N1 IPD peak in response to 750 Hz stimuli. This model yielded an adjusted R2 value of 0.606. (B) Observed spatial release from masking measurements for individuals in experiment #2 plotted as a function of the amount of spatial release from masking predicted by a linear regression model based on the N1 IPD amplitude and P2 IPD latency in response to the 750 Hz carrier stimulus. This model yielded an adjusted R2 value of 0.511.
