Figure 3.

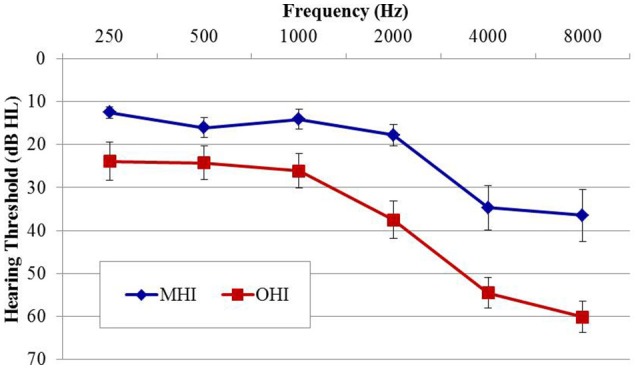
Group mean audiograms averaged across ears for the middle-age (MHI) and older hearing-impaired (OHI) participant groups in experiment #2. Error bars indicate ± 1 SEM.

Group mean audiograms averaged across ears for the middle-age (MHI) and older hearing-impaired (OHI) participant groups in experiment #2. Error bars indicate ± 1 SEM.