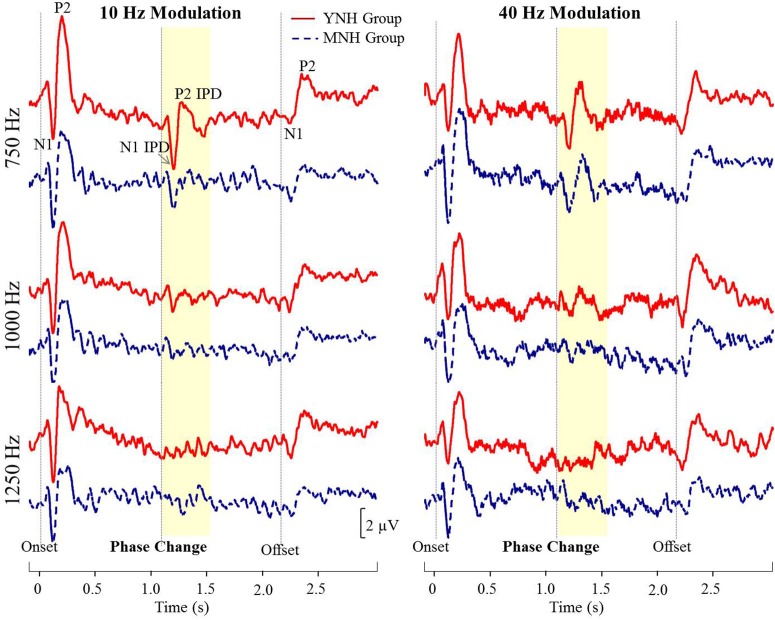
Figure 4.
Grand averaged waveforms for each group in experiment #1. The yellow segment highlights the portion of the waveforms reflecting response to the interaural phase difference (IPD). For reference, N1 and P2 peaks in response to stimulus onset, IPD, and offset are labeled for the young normal-hearing (YNH) group in response to the 750 Hz carrier at 10 Hz modulation.

