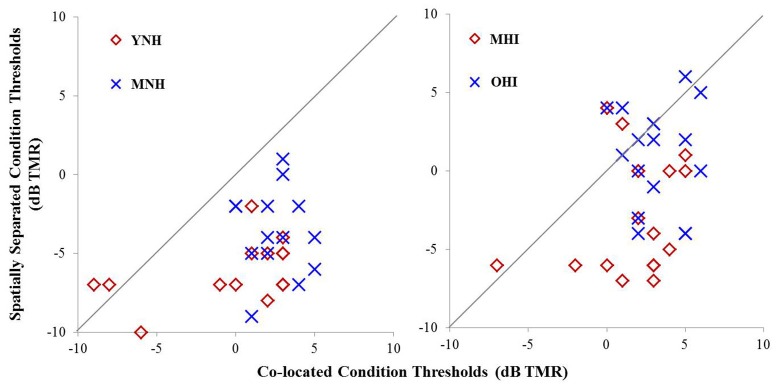
Figure 5.
Performance on speech understanding in noise task among participants in experiment #1 (left panel) and experiment #2 (right panel). Thresholds obtained in the co-located condition are plotted as a function of thresholds obtained in the spatially separated condition. The gray line indicates unity between thresholds obtained in the two conditions.

