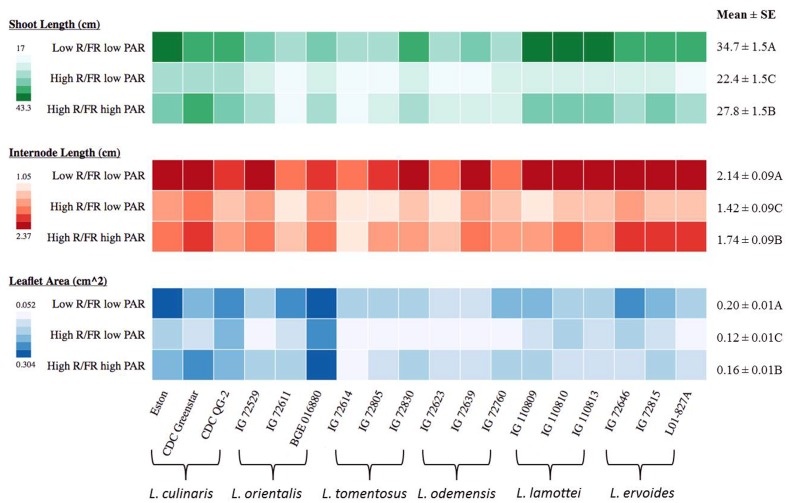
FIGURE 3.
Shoot length, internode length, and leaflet area for three genotypes of each of six Lens species grown in light environments differing in red/far-red ratio (R/FR) and photosynthetically active radiation (PAR). Mean ± SE is from two repeats (eight replicates) for shoot length and internode length while one repeat (five replicates) for leaflet area and represents all Lens genotypes grown in the specific light environment. Different letters represent significant differences among treatments (Tukey’s test at p ≤ 0.05). Heat map is generated using the in-house developed computer program and the monochrome color coding system was used for each trait with the color from lighter to darker represented the values from lower to higher.

