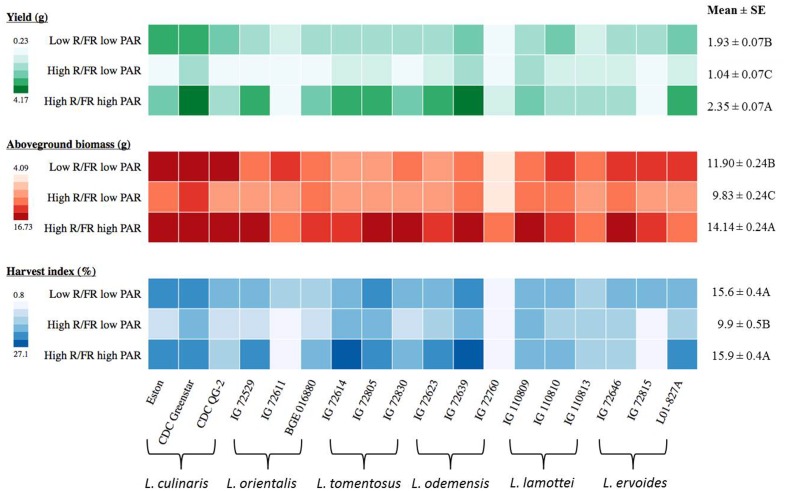
FIGURE 4.
Yield, above-ground biomass, and harvest index for three genotypes of each of six Lens species grown in light environments differing in red/far-red ratio (R/FR) and PAR. Mean ± SE is from two repeats (eight replicates) for yield and one repeat (four replicates) for above-ground biomass and harvest index and it represents all Lens genotypes grown in the specific light environment. Different letters represent significant differences among treatments (Tukey’s test at p ≤ 0.05). Heat map is generated using the in-house developed computer program and the monochrome color coding system was used for each trait with the color from lighter to darker represented the values from lower to higher.

