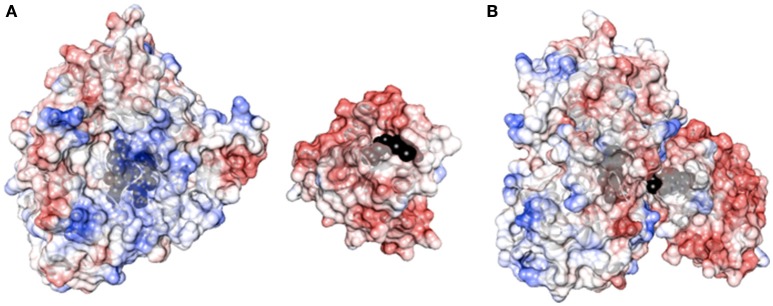
Figure 1.
(A) Surface charge distribution of P450 3A4 (left, PDB ID 1TQN) and the FMN binding domain of P450 BM3 (right, PDB ID 1BVY). Heme and FMN are shown in black. (B) Complex between P450 3A4 and the FMN binding domain of BMR. The complex was created by super-imposition of the crystal structure of P450 3A4 with the heme domain of P450 BM3 in the complex crystal structure.

