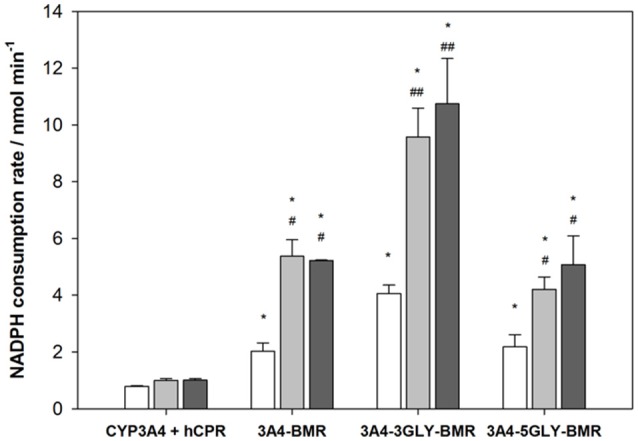
Figure 4.

Anaerobic NADPH oxidation rates for cytochrome P450 3A4-BMR, 3A4-3GLY-BMRand 3A4-5GLY-BMR compared to those obtained for CYP 3A4 + hCPR system, obtained both in absence (white bars) and in presence of substrate erythromycin (light gray) and testosterone (dark gray). Data are mean ± SD for 3 to 6 replicates. *P < 0.001 compared to CYP 3A4 + hCPR system; #P < 0.05, ##P < 0.001 compared to the protein in absence of substrate; two way ANOVA.
