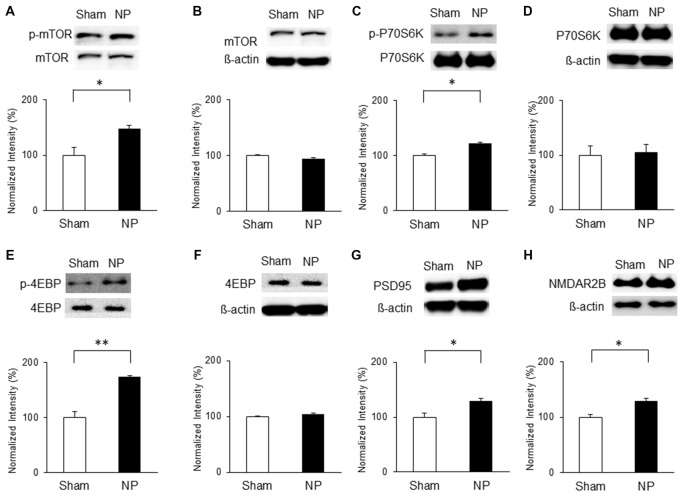
Figure 3.
Phosphorylation of mammalian target of rapamycin (mTOR), p70 ribosomal S6 protein kinase (P70S6K) and 4E binding protein (4EBP), and expression of postsynaptic density protein 95 (PSD95) and NMDAR2B in the IC on POD3 after nerve injury. (A,B) p-mTOR increased in the NP group compared with the Sham group, but total mTOR levels were not significantly different on POD3. (C,D) p-P70S6K increased in the NP group compared with the Sham group, but total P70S6K levels were not different. (E,F) p-4EBP increased in the NP group compared with the Sham group, but total 4EBP levels were not different. (G,H) PSD95 and NMDAR2B levels increased significantly in the NP group compared with the Sham group. The intensity of the phospho-form band was normalized to that of the total form, and the total form bands were normalized to β-actin protein. Data are presented as means ± SEM. *P < 0.05, **P < 0.01 vs. Sham.

