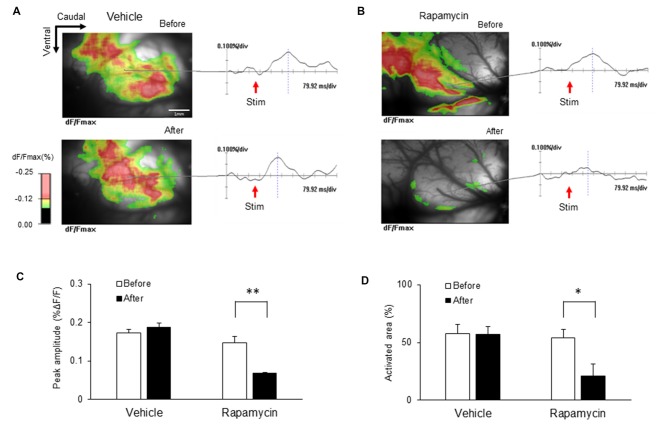
Figure 9.
Changes in optical signals before and after treatment with rapamycin and vehicle. (A) Optical signals before and after vehicle treatment. (B) Optical signals before and after rapamycin treatment. (C) Peak amplitudes before and after vehicle and rapamycin treatments following peripheral electrical stimulation with 5.0 mA intensity. (D) Activated areas before and after vehicle and rapamycin treatments following peripheral electrical stimulation with 5.0 mA intensity. The peak amplitudes and activated areas induced by peripheral electrical stimulation after rapamycin treatment were reduced compared with those before rapamycin treatment. However, they are not significantly different in both before and after vehicle treatment. *P < 0.05, **P < 0.01.

