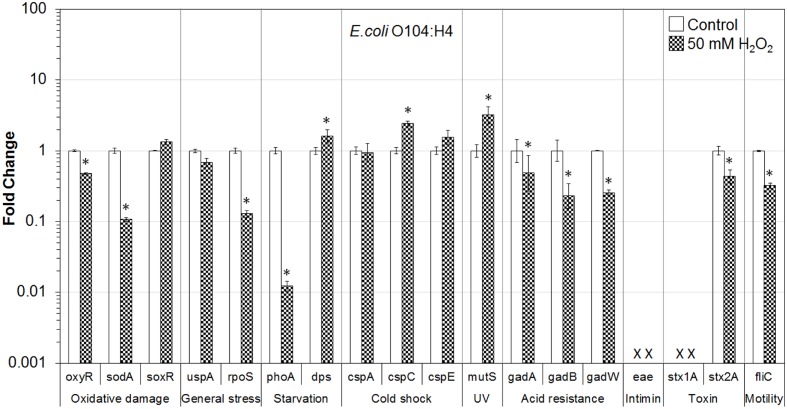
FIGURE 2.
Effect of H2O2 on gene transcription of E. coli O104:H4. Relative gene transcription represents the change in transcription compared to the bacteria without H2O2 treatment (control, value of 1.0). The transcription of each gene was normalized to the 16S rRNA transcription in each sample. Data are expressed as the means ± SE for RNA extracted in three biological replicates. × denotes absence of eae and stx1A genes in E. coli O104:H4. ∗indicates the significant change of gene transcription between treatment and control.

