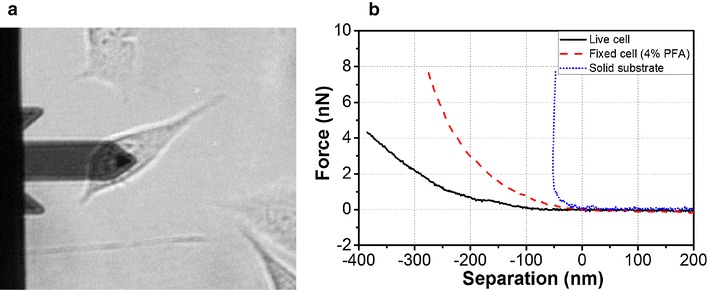
Fig. 4.

a Optical image of AFM tips positioning on the target cell. b Typical force-separation curve for a fixed cell (4% PFA-treated cell), live cell, and solid substrate. Compared to live cells, the slope of fixed cells approach curve is steeper, indicating a significantly larger Young’s modulus for fixed cells
