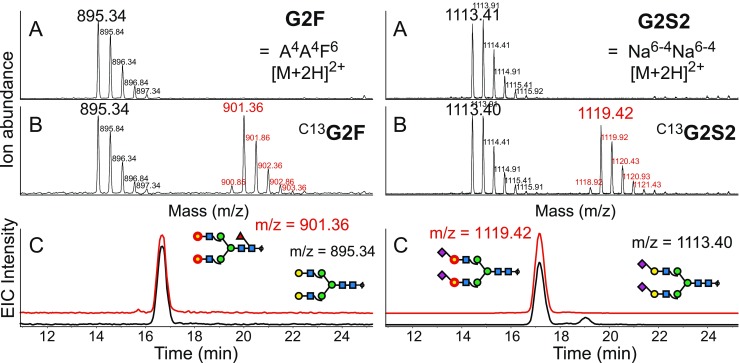
Fig. 4.

Mass spectra of G2 and G2S2 in unspiked and spiked samples (A, B). Note that the isotope-coded glycans emerge in unoccupied spaces in the spectra. The spectra demonstrate the different isotope distributions of natural glycans and 12 13C-containing glycans. Panels C confirm the identical chromatographic behavior of the isotopologues. The 13 C 6-galactose residues are labeled with red circles. EIC extracted ion chromatogram
