Fig. 2.
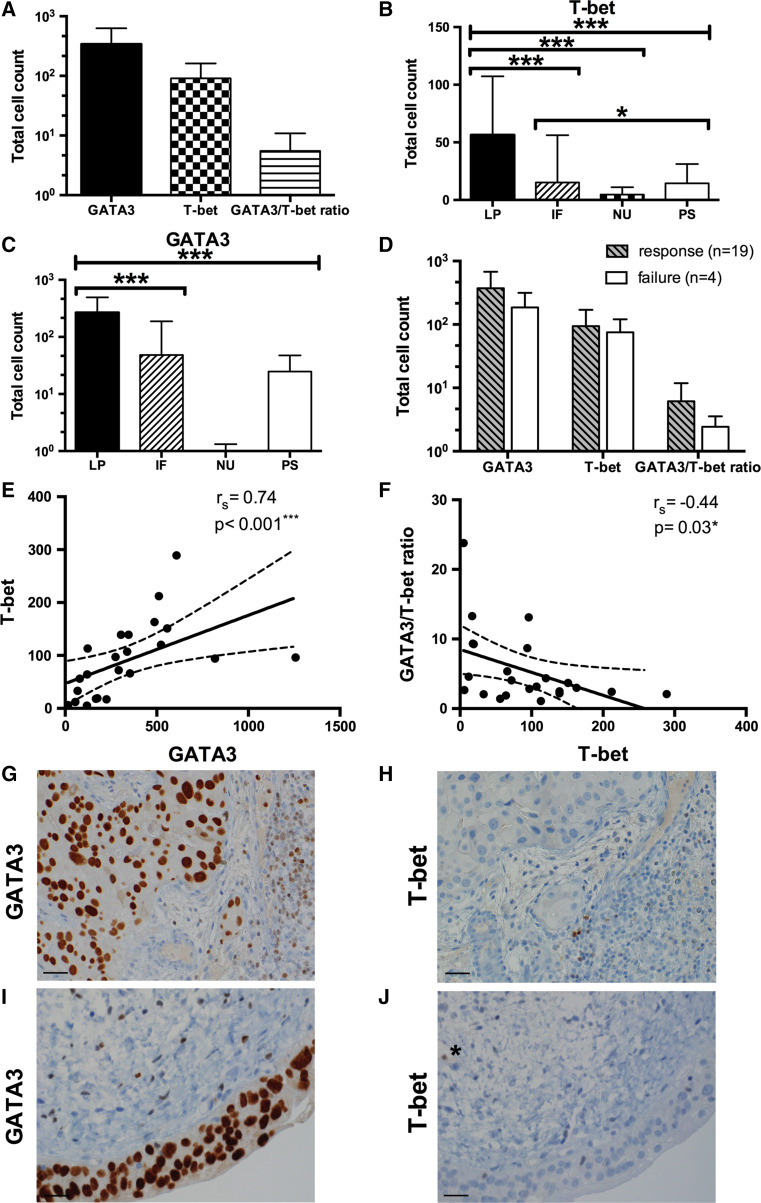
GATA3 and T-bet expression of tumor-infiltrating immune cells prior to BCG therapy. a Distribution of GATA3+, T-bet+ T cells and GATA3/T-bet ratio in all patients; data represent mean ± SEM. b, c Abundance of GATA3+ and T-bet+ T cells based on analyzed tumor areas. Data represent mean ± SEM. *p < 0.05; **p < 0.01; ***p < 0.001; Friedman’s tests and Wilcoxon’s signed-rank tests. d Frequency of GATA3+, T-bet+ tumor-infiltrating T cells and GATA3/T-bet ratio with respect to treatment outcome (response vs. failure). Data represent mean ± SEM; Mann–Whitney U test. e, f Correlation analysis (and confidence bands) of GATA3, T-bet and GATA3/T-bet ratio; *p < 0.05; **p < 0.01; ***p < 0.001. g Superficially invasive bladder cancer with a high count of GATA3+ tumor-infiltrating lymphocytes and h low expression of T-bet+ T cells; Scale bar ~40 µm; i carcinoma in situ with few GATA3+ T cells and j only one intravascular T-bet+ T cell (marked with *); Scale bar ~40 µm. LP lamina propria without invasion, IF invasive front, NU neoplastic urothelium, PS papillary stroma, r s Spearman’s rank correlation coefficient

