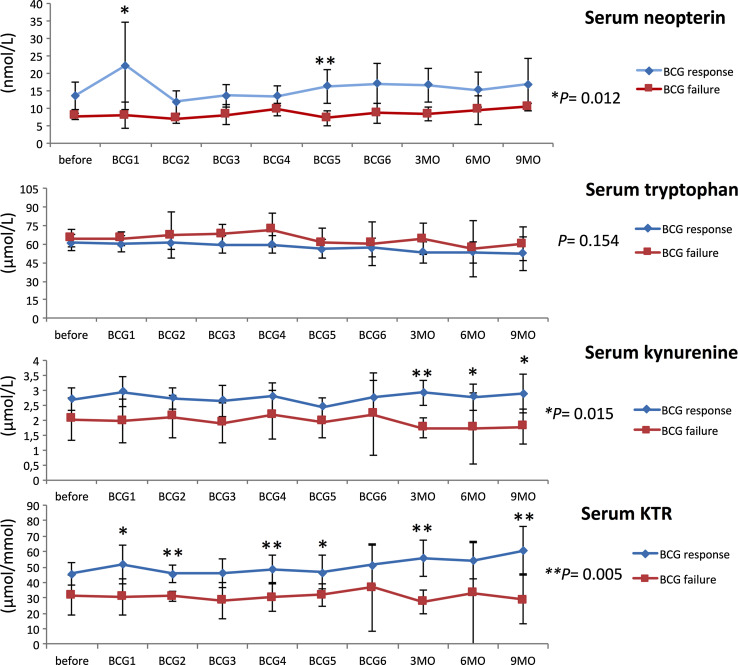
Fig. 3.
Levels of serum neopterin and tryptophan degradation at baseline, during and after BCG therapy. Patients were stratified by treatment outcome (BCG response vs. failure). Data represent mean ± 95% confidence interval (CI); *p < 0.05; **p < 0.01; ***p < 0.001; overall p value from a mixed model analysis for repeated measures between responders and non-responders; Mann–Whitney U tests for single time point comparisons. KTR kynurenine-to-tryptophan ratio

