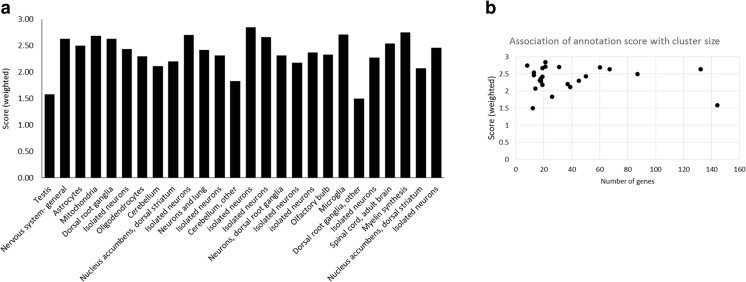
Fig. 2.
Gene ontology annotation scores for each gene cluster. a Bar graph showing overall weighted annotation scores for the gene clusters. Genes within each cluster were scored either 0 or 1 for each of the three gene ontology categories (GO cellular compartment, GO biological process, GO molecular function) depending on the absence or presence (no matter how minimal) of GO information. An average weighed score was calculated for each cluster (maximum score of 3 if each GO category had an entry for each gene in the cluster). Scores ranged from 1.50 (Cluster088, dorsal root ganglion) to 2.77 (Cluster045, isolated neurons). Clusters are shown in the order of cluster number (see Table 2). b Scatterplot of number of genes in a cluster compared with the weighed annotation score. The testis cluster was excluded from the graph because it had 10 times more genes than the next cluster (total 1628); the result when testis was included was similar

