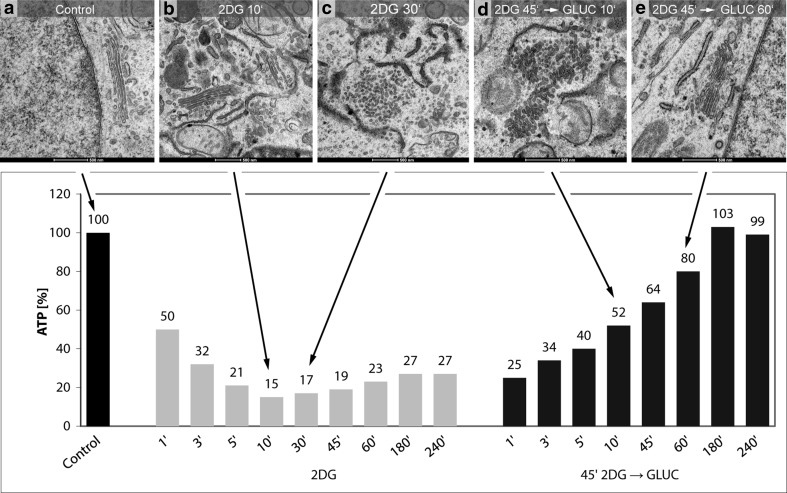
Fig. 12.
Artwork shows the results of correlative ATP-analyses and ultrastructural analyses highlighting the ATP-levels and the corresponding Golgi apparatus morphologies at 10 and 30 min of 2DG-treatment and 10 and 60 min after 2DG-removal and incubation in glucose-containing medium. a Regularly structured Golgi apparatus stack of a control cell. The results shown in b and c make evident that the processes leading to a replacement of the regular Golgi stacks by Golgi bodies occurs in a phase of low cellular ATP-concentrations. d The occurrence of mini-stacks within the Golgi bodies, indicating the beginning of Golgi apparatus re-formation, coincides with the ATP-level increase after removal of 2DG. The picture in panel e exhibits a control-like regularly structured Golgi stack after ATP-replenishment

