Fig. 5.
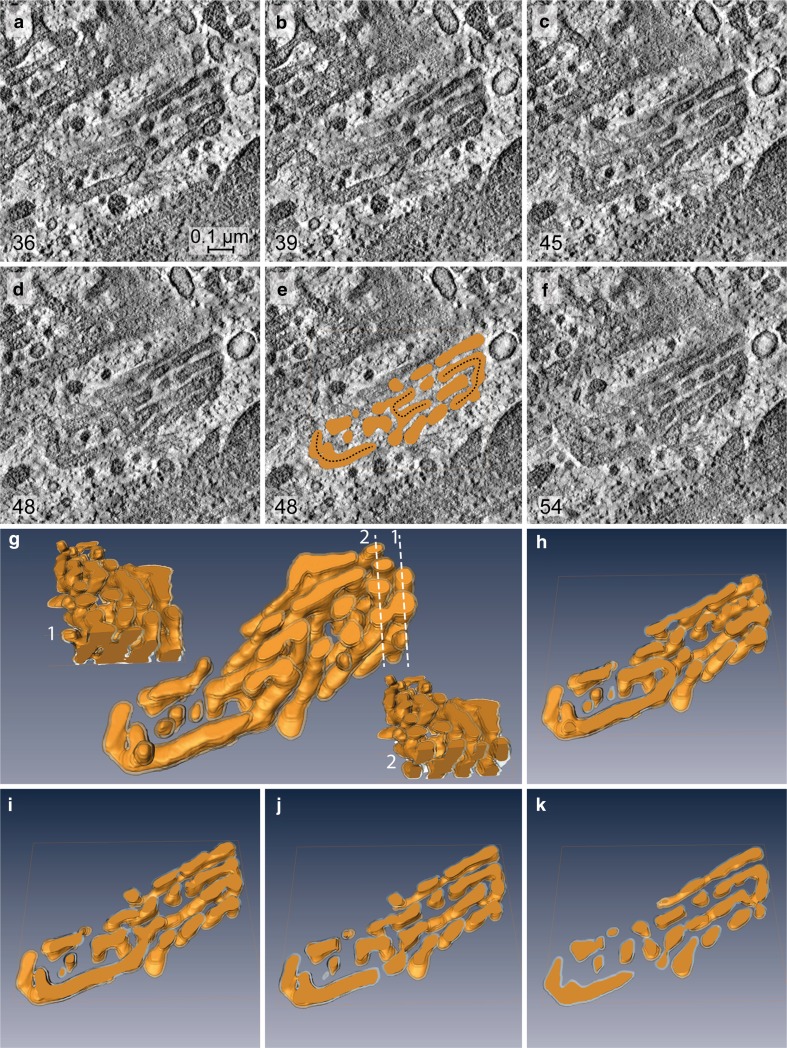
a–f Tomographic slices obtained from different levels of a Golgi stack reconstruction after 10 min of 2DG-treatment; the respective 3D-model is on display in g–k. Both the slices and the model, in part sectioned vertically (g1 and g2) and horizontally (h–k), provide views inside the stack. The image shows that a parallel organization of cisternae still exists but is interrupted by arches, branches and wide pores resulting in the occurrence of reticular regions within the stack. Regularly ordered cisternae and reticular areas are located side by side, as is particularly clearly shown in g. In e, slice 48 is shown together with the respective horizontal section through the model, and the connecting arches present within the stack are accentuated by dotted lines. The numbers in the left lower corner of a–f indicate the respective slice numbers within the reconstructed stack. Volume of the calculated tomogram (x, y, z): 989 × 976 × 61 pixels, pixel size 1.84 nm

