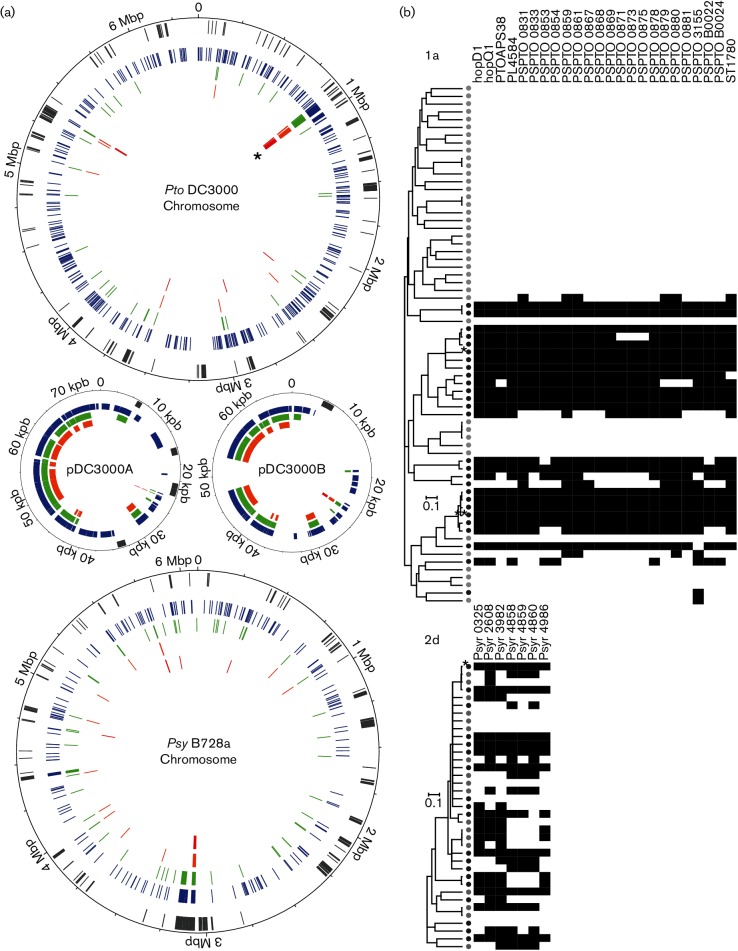
Fig. 3.
Distribution of genes associated with P. syringae crop pathogen strains within reference genomes and within populations. (a) The 30 bp long words that were found to be significantly associated with crop pathogens in either phylogroup 1a or 2d were mapped on the genome of the reference crop pathogens Pto DC3000 and Psy B728a, respectively. A total of 73 299 and 5970 crop pathogen-associated words in Pto DC3000 and Psy B728a were distributed in 571 and 222 genes, respectively. The list of these genes and the distribution of mapped words is given in Table S4. For each chromosome and plasmid, the first grey circle represents virulence genes (listed in Lindeberg et al., 2008). The next four coloured circles correspond to the genes in which words were mapped from the highest to the lowest probability (blue, green, orange and red corresponding to P value cutoffs of 5×10⁻⁴, 5×10⁻⁵, 5×10⁻⁶ and 5×10⁻⁷, respectively). The 25 kb region containing hopQ1 and hopD1 described in the text is indicated with an asterisk. (b) Heatmaps showing the presence of genes for which at least one word was significantly associated with crop pathogens with a probability inferior or equal to 5×10⁻⁷. Black boxes denote that at least one word was mapped for the corresponding isolate and gene, while white boxes denote that not a single word was present with this probability. Isolates were organized following the core genome trees built with ClonalFrame (Didelot & Falush, 2007) in Fig. 1(b). The trees are drawn to scale, with branch lengths proportional to the number of substitutions per site. Dark and light grey circles symbolize crop pathogen strains and environmental isolates, respectively.

