Fig. 5.
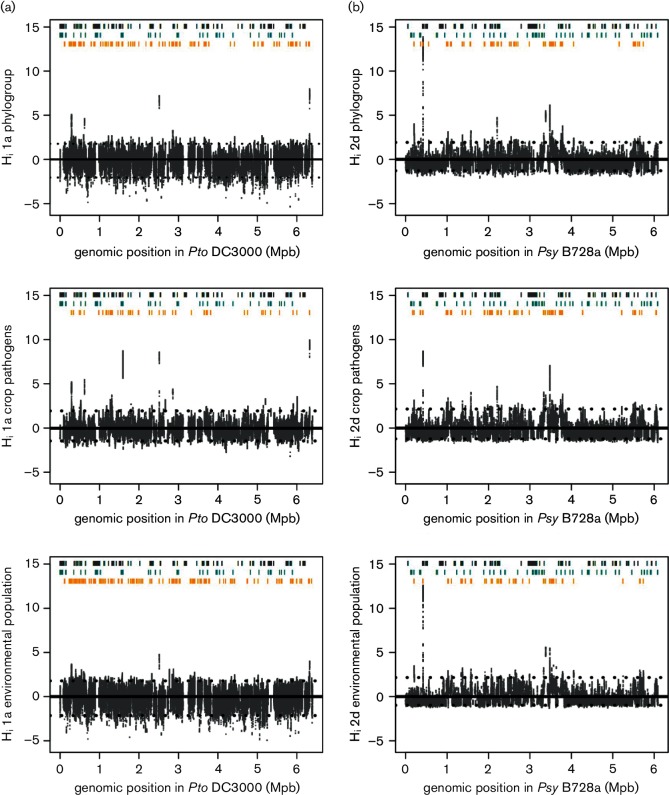
Inference of homologous recombination hotspots within P. syringae populations. Homologous recombination hotspots were inferred in phylogroups 1a (a) and 2d (b) as described by Yahara et al. (2014). A total of 177 790 and 141 997 SNPs were used, respectively, representing the chromosome of each reference genome. For each group, the extent of recombination was estimated from the whole phylogroup, from the crop pathogen strains only and, finally, considering only isolates from environmental reservoirs. The x-axis indicates the position in the reference genomes Pto DC3000 (Buell et al., 2003) and Psy B728a (Feil et al., 2005). The y-axis indicates the empirical distribution of the distance statistic Hi representing the intensity of normalized recombination. The solid line represents the average value of Hi in a genome The dotted lines represent the top and bottom 2.5 percentiles. Grey lines represent virulence genes (Lindeberg et al., 2008). Turquoise lines represent genes associated with being a crop pathogen using the GWAS approach (Table S4). Orange lines represent genes associated with hotspots of recombination. The genes in the regions showing more intense recombination are given in Table S5.

