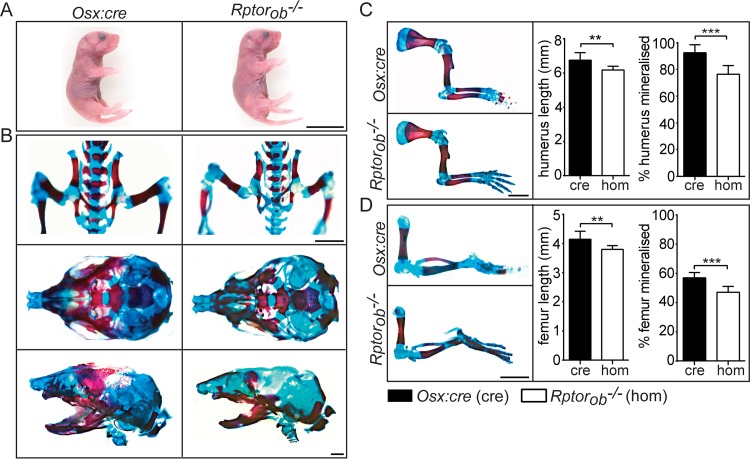
FIG 2.
Prenatal skeletal phenotype in Rptorob−/− mice. (A) Images of newborn (P0) Osx:cre (cre) and Rptorob−/− (hom) mice. Scale bar, 10 mm. (B) Newborn mice were stained with alizarin red and alcian blue to visualize mineralized bone (red) and cartilage (blue). (Upper panel) Images of the pelvic cage. Scale bar, 5 mm. (Middle panels) Superior view of the skull. (Lower panels) Lateral view of the skull. Scale bar, 1 mm. (C) Forelimbs of Osx:cre and Rptorob−/− mice. The length of the humerus and the percentage of the humerus that is mineralized were measured. Scale bar, 5 mm. (D) Hind limbs of Osx:cre and Rptorob−/− mice. The length of the femur and the percentage of the femur that is mineralized were measured. Scale bar, 5 mm. Data are presented as means ± the SD (n = 6 per group). **, P < 0.01; ***, P < 0.001.

