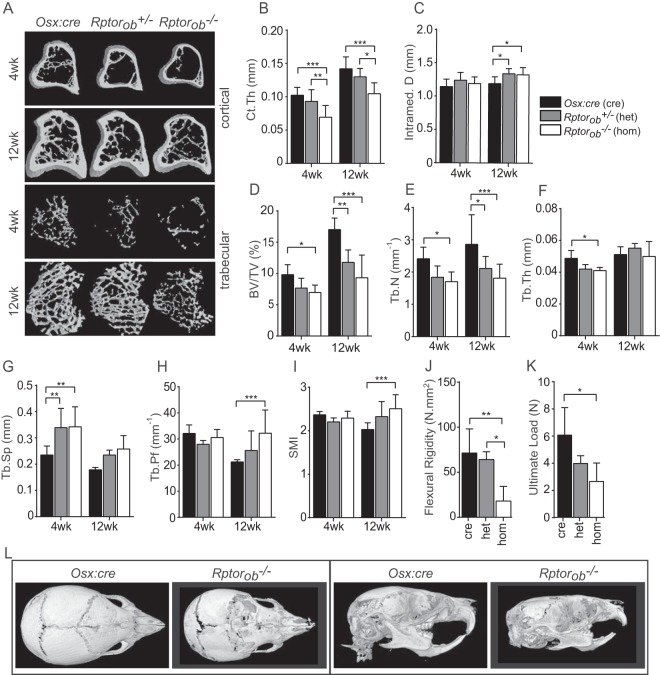
FIG 4.
Low postnatal bone masses in Rptorob−/− mice. (A) Cross-sectional μCT images of cortical and trabecular bone (tibia) of Osx:cre, Rptorob+/−, and Rptorob−/− mice. (B and C) Cortical thickness (Ct.Th) (B) and intramedullary diameter (C) of the cortical bone. (D to G) Quantitative assessment of the trabecular bone of the tibia. BV, bone volume; TV, total volume; Tb.Th, trabecular thickness; Tb.N, trabecular number; Tb.Sp, trabecular seperation. (H and I) Quantitative assessment of structural indices of the trabecular bone architecture of the tibia. Tb.Pf, trabecular pattern factor; SMI, structural model index. (J and K) Femurs from control and knockout animals were subjected to 3-point load testing. (L) μCT images of the skulls of 4-week-old Osx:cre and Rptorob−/− mice. (Left panels) Superior view of skulls; (right panels) lateral view of skulls. Measurements are presented as means ± the SD (n ≥ 6 per group). *, P < 0.05; **, P < 0.01; ***, P < 0.001.

