
FIG 5.
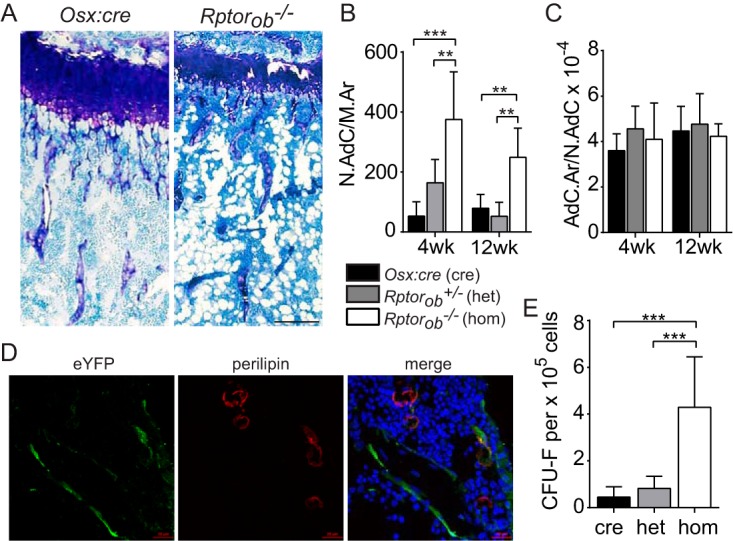
Elevated levels of intramedullary adipose in Rptorob−/− mice. (A) Toluidine blue-stained tibial sections of Osx:cre (cre) and Rptorob−/− (hom) mice. Adipocytes appear as cleared circles. Scale bar, 200 μm. (B and C) The numbers of adipocytes per area of the intramedullary space (N.Adc/M.Ar) (B) and the areas occupied by adipocyes per number of adipocytes (AdC.Ar/N.AdC) (C) were quantified using histomorphometry. (D) Two-color confocal microscopy was used to detect overlapping eYFP and perilipin staining in frozen tibial sections isolated from 4-week-old eYFP-Osx:cre and eYFP-Rptorob−/− mice. Nuclei are stained with DAPI. Scale bar, 20 μm. (E) Compact bone cells were isolated from the long bones of Osx:cre (cre), Rptorob−/+ (het), and Rptorob−/− (hom) mice, and the numbers of CFU-F per 105 cells plated were enumerated. Measurements are presented as means ± the SD. **, P < 0.01; ***, P < 0.001.