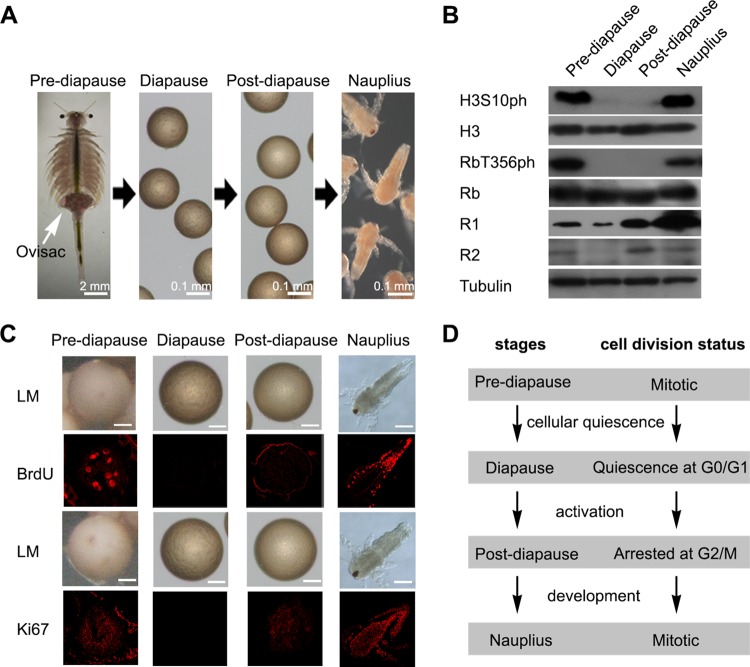
FIG 1.
Stages during diapause formation and cell quiescence in Artemia diapause embryos. (A) The stages during diapause formation are prediapause, where the embryos are in the ovisac (white arrow); diapause; postdiapause; and nauplius. (B) Western blot analysis of the phosphorylation of the cell proliferation markers H3S10ph and RbT356ph and the DNA synthesis markers R1 and R2 at each developmental stage. Tubulin was used as a loading control. (C) BrdU incorporation assays and immunofluorescence analysis of Ki67 at each developmental stage. Light microscopy (LM) images were taken to show the overall morphology. Red, incorporated BrdU and Ki67 detected by Alexa Fluor 647-conjugated secondary antibody. Bars, 50 μm. (D) Diagram of cell cycle progression in embryos during diapause formation and termination.

