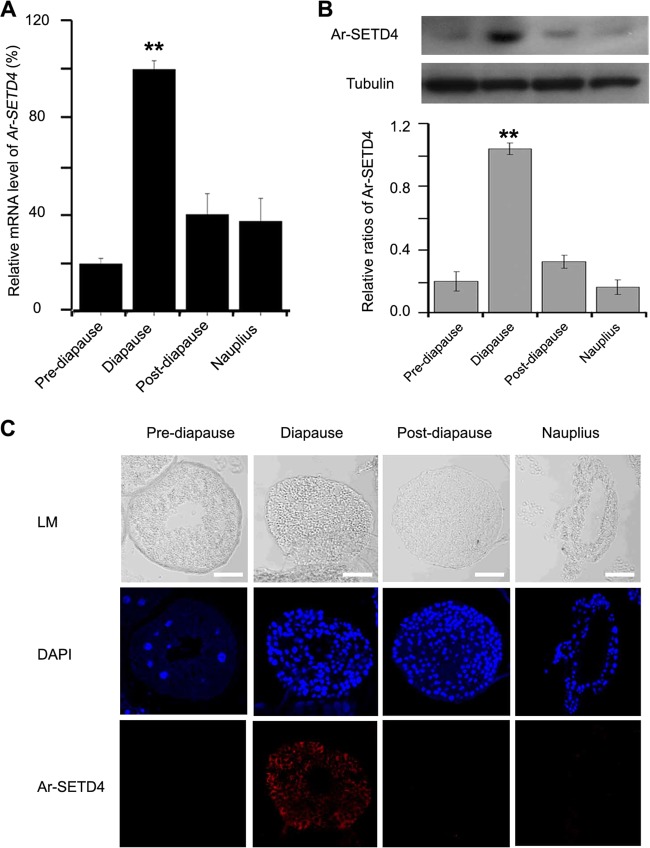
FIG 3.
Expression of Ar-SETD4 at each developmental stage during diapause formation in Artemia. (A) Real-time quantitative PCR analysis of Ar-SETD4 mRNA expression at each developmental stage. The mRNA amounts were normalized to those of tubulin mRNA. The means of data from three independent biological replicates are shown; error bars represent the standard errors of the means. **, P < 0.01 by a one-tailed t test. (B) Western blot analysis of Ar-SETD4 expression at each developmental stage. Tubulin was used as a loading control. The relative band intensities were quantified by using ImageJ software, and the ratio of Ar-SETD4 to tubulin is presented. The values are means ± standard deviations (n = 3). Statistical significance was determined by a one-tailed t test (**, P < 0.01). (C) Immunofluorescence analysis of Ar-SETD4 at each developmental stage. Light microscopy (LM) images were taken to show the overall morphology. Red, Ar-SETD4 detected by Alexa Fluor 647-conjugated secondary antibody; blue, nuclei counterstained with DAPI. Bars, 50 μm.

