
FIG 5.
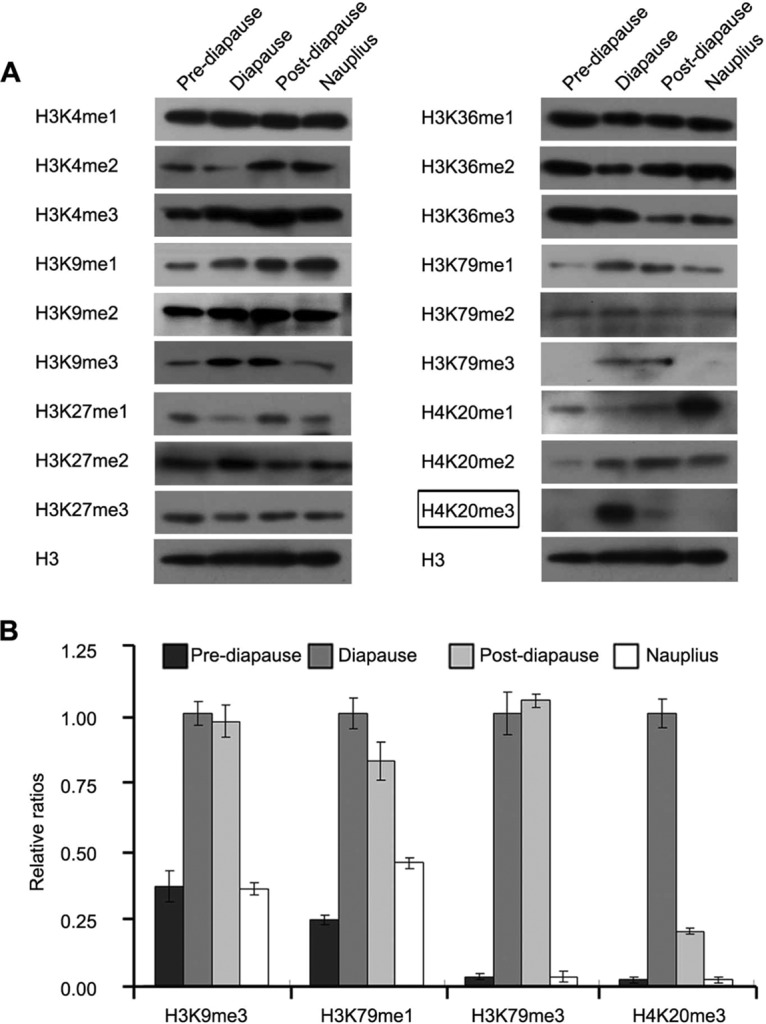
Methylation of H3 and H4 at various lysine residues during diapause formation. (A) Western blot analyses of the levels of methylation of H3 and H4 at various positions during each developmental stage. H3 was used as a loading control. At the diapause stage, high levels of H4K20me3 were specific for the diapause embryo stage (indicated by a box). (B) The relative band intensities in panel A were quantified by using ImageJ software, and the ratios of H3K9me3, H3K79me1, H3K79me3, and H4K20me3 to H3 are presented. The values are means ± standard deviations (n = 3). Statistical significance was determined by a one-tailed t test.