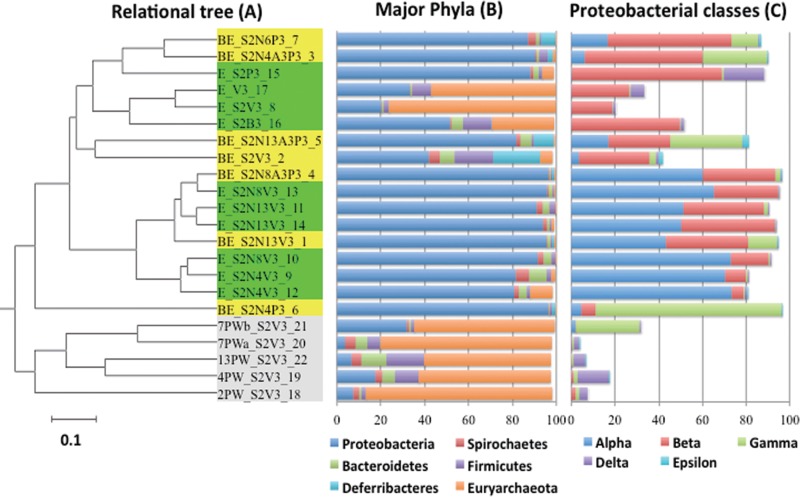
FIG 5.
Analysis of 16S rRNA gene sequences (reads) in 22 amplicon libraries, identified by name and number as described for Table 2. (A) Relational tree; the bar represents 0.1 substitutions per nucleotide position. Clades I and II are indicated, as explained in the text. (B and C) Fractions of phyla (percent total reads) (B) and fractions of classes (percent Proteobacteria reads) (C).

