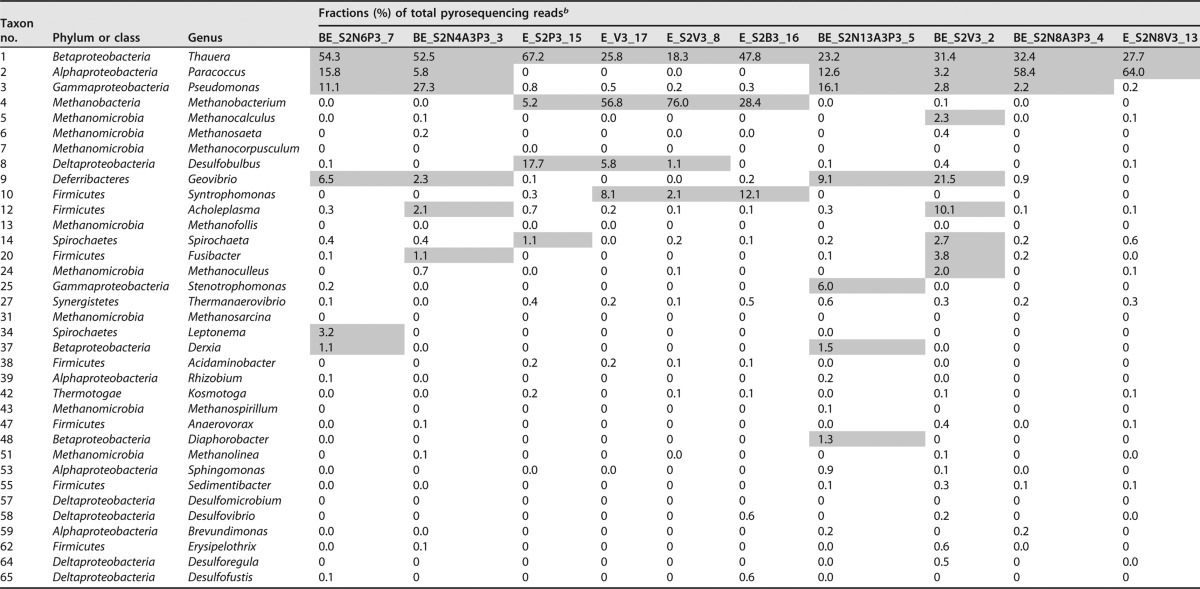
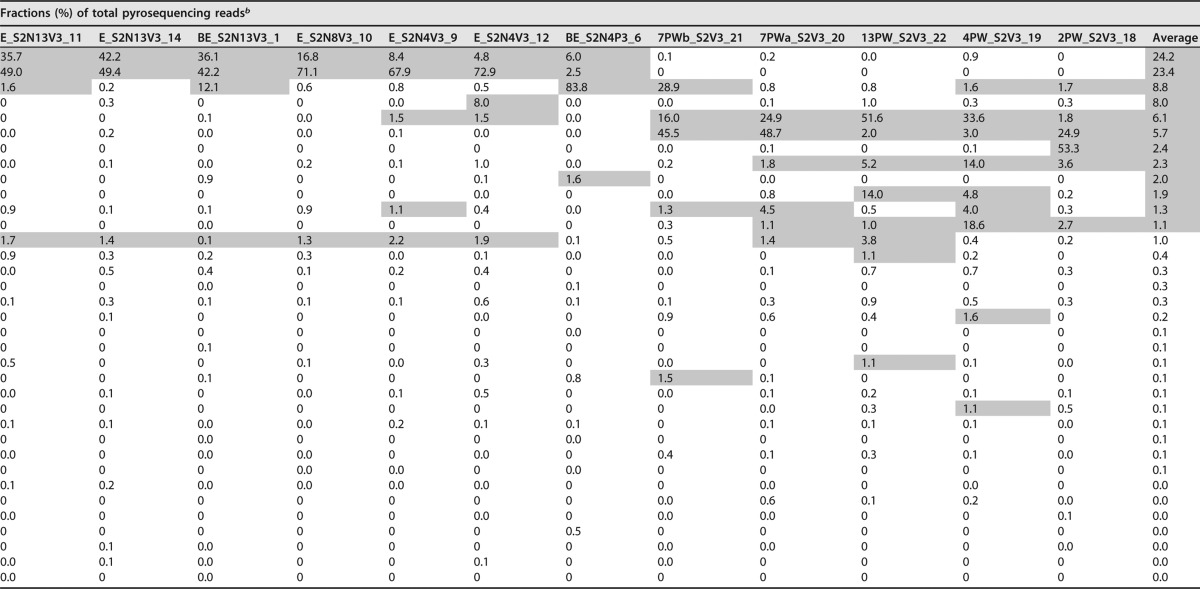
TABLE 3.
Taxa in 16S rRNA libraries from microcosms and bioreactor effluentsa
Taxa are presented in the same order as in the dendrogram in Fig. 5A. Library numbers (1 to 22) are as indicated in Fig. 1 to 4 and Fig. S1 to S4.
The numbers shown are fractions (percent) of total pyrosequencing reads. Fractions in excess of 1% are indicated with gray shading. The data in the table are ranked according to average fraction values. Missing entries (e.g., entries 15 to 19) could not be assigned at the genus level.


