
FIG 5.
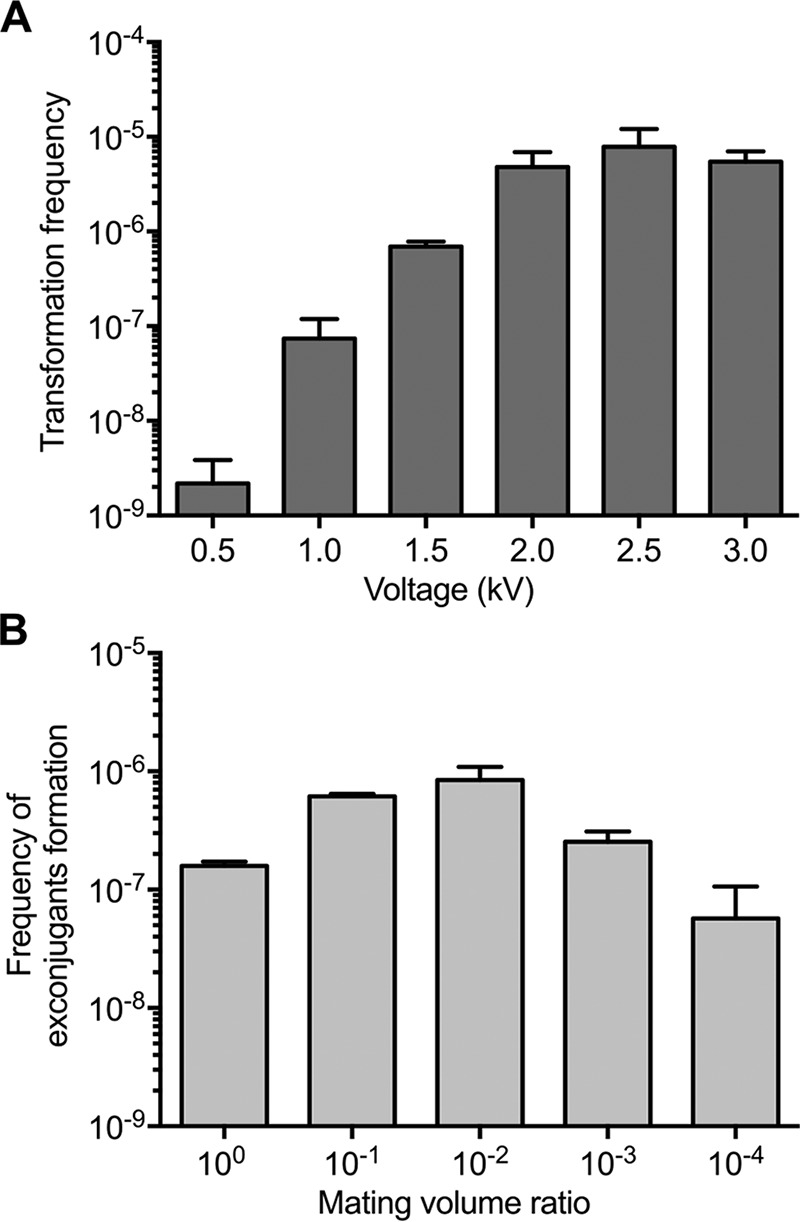
Frequencies of plasmid introduction in M. florum by electroporation or conjugation. (A) Transformation frequencies of pMflT-o4 in M. florum L1 using the electroporation procedure with 1-mm cuvettes and different voltage values. Error bars indicate the standard deviations from the results of three independent biological replicates. (B) pMflT-o4 transfer rates by conjugation using different mating volume ratios of donor (E. coli MFDpir) and recipient cells (M. florum L1). Indicated mating volume ratios are calculated by dividing the volume of M. florum culture by the volume of E. coli culture mixed during the conjugation process (see Table S3). pMflT-o4 transfer frequency is expressed as the number of exconjugants per viable recipient CFU. Error bars indicate the standard deviations from the results of three independent biological replicates.