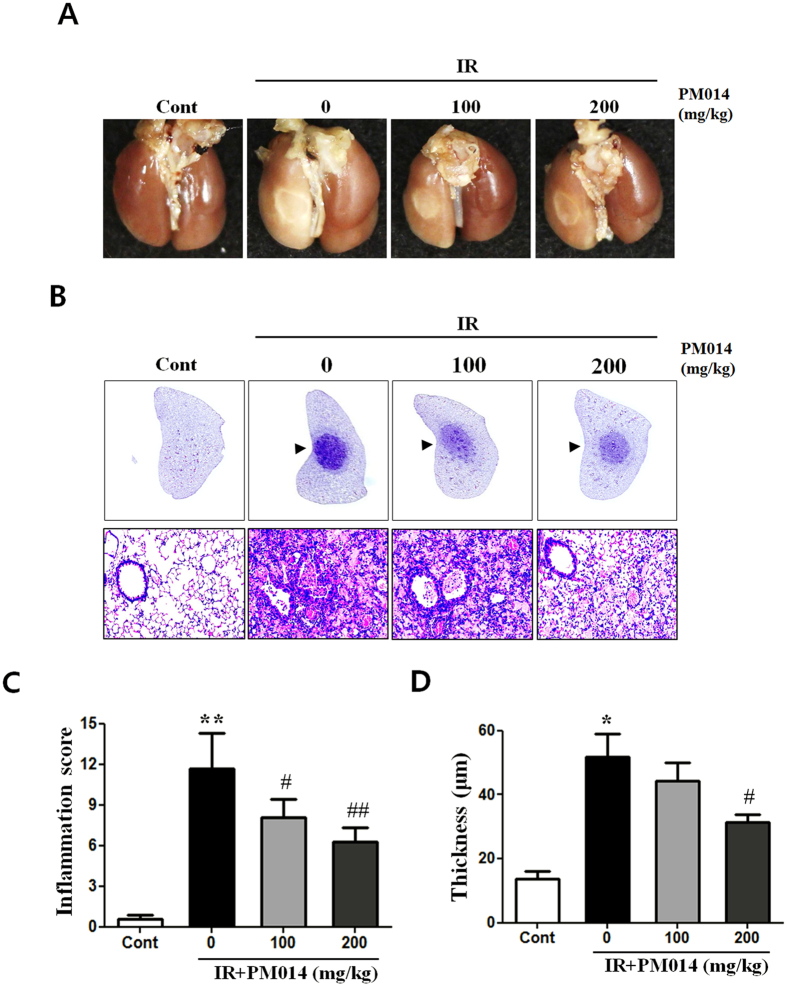
Figure 1. Effect of PM014 on gross morphology.
Control, untreated; 0, irradiation (IR) +phosphate buffered saline (PBS); 100, irradiation +100 mg/kg PM014; and 200, irradiation +200 mg/kg PM014. (A) Mice were sacrificed at 2 weeks after irradiation. Lungs were photographed after complete fixation. (B) Haematoxylin and eosin-stained lung sections. Arrows indicate areas of radiation-induced injury. Magnification, 20x, 400x. (C) Quantification of inflammatory foci. (D) Thickness of bronchiolar epithelium. Data are expressed as mean ± standard error (*P < 0.05, **P < 0.01 versus control; #P < 0.05 and ##P < 0.01, versus IR + PBS; n = 7–10).

