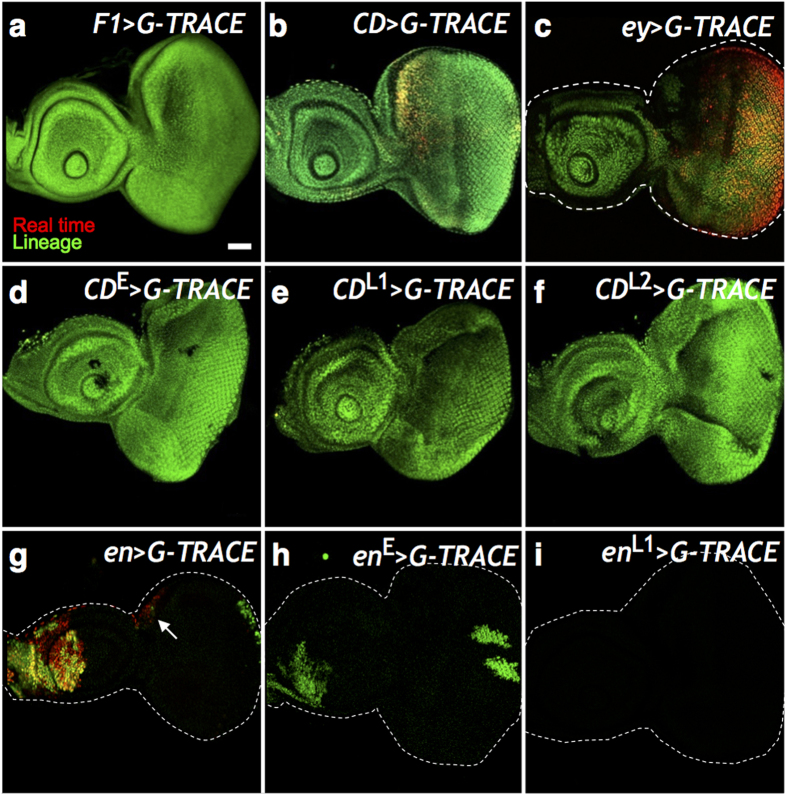
Figure 1. Stage-specific lineage analysis.
The G-TRACE reporters RFP and GFP were driven by (a) F1-GAL4 (F1 > G-TRACE), (b) CD-GAL4 (CD > G-TRACE), and (c) ey-GAL4 (ey > G-TRACE). Late third instar (L3) EAD were examined. The RFP (red) represents real time expression, while GFP (green) represents lineage expression. (a) F1 was expressed only in embryo, therefore showed no real time expression in the L3 EAD. (b) CD real time expression mimics eyg expression in the equator and the anterior dorsal region in the L3 eye disc. (c) ey real time expression in the L3 eye disc. (a–c) The lineage expression (green) of F1, CD, and ey comprised entire EAD. (d–f) Stage-specific CD > G-TRACE in embryonic, L1 and L2 stages (designated as CDE, CDL1 and CDL2, respectively). CD+ cells in the embryonic, L1, and L2 stages contributed to the entire EAD. Since the GAL80ts blocked the GAL4 activity in L3, there was no real time expression in the L3 EAD. (g) The G-TRACE reporters driven by en (en > G-TRACE). en+ cells contributed to the posterior compartment of the antenna and eye disc. Real-time en expression in L3 was in the posterior compartment of the antenna disc and in the ocellar region (white arrow) in the eye disc. (h–i) Stage-specific en > G-TRACE in embryonic and L1 stages (designated as enE and enL1, respectively). en+ cells in the embryonic stage contributed to the posterior compartment of the antenna and eye discs. Note the inverted anterior-posterior axis of antenna disc relative to that in the eye disc. en+ cells in L1 did not contribute to the L3 EAD, suggesting that en was not expressed in L1 EAD. Scale bar is 50 μm and the anterior is to the left in all frames.

