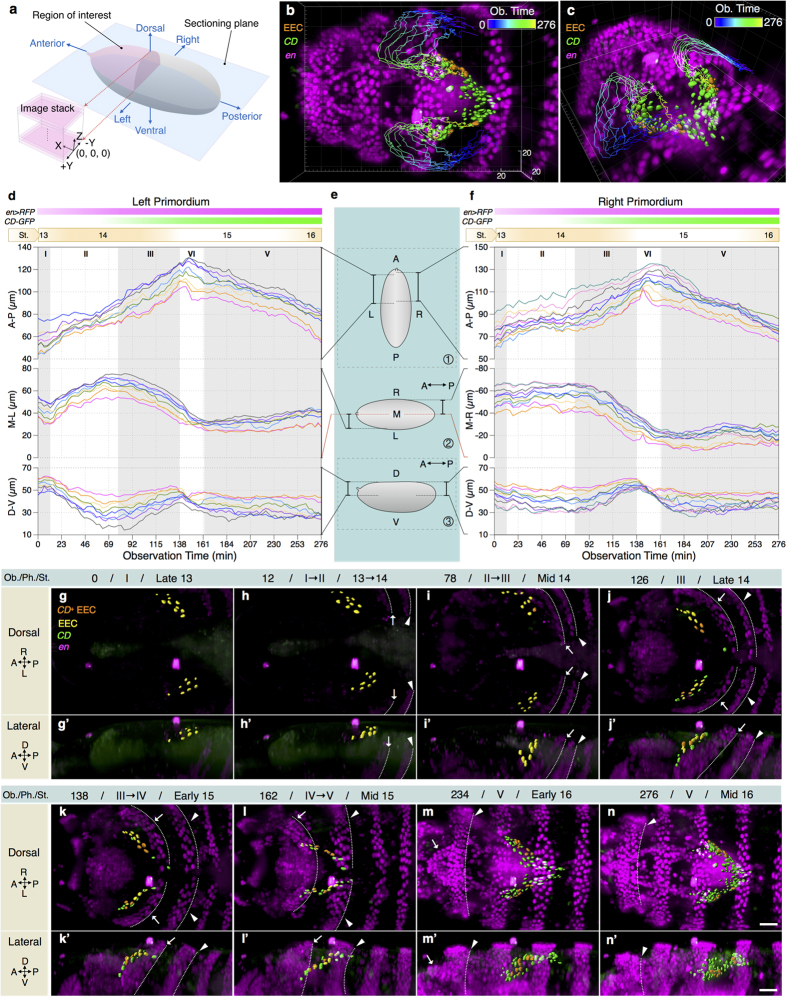
Figure 2. The origin and movement of EECs.
(a) A schematic illustration of the region of interest, embryo orientation and the 3D coordinates of an image stack. The imaging plane was parallel to the sectioning plane. (b) The trajectories of EECs, over the observation time 0 to 276 min, displayed with the 3D fluorescence patterns of en > RFP (magenta) and CD-GFP (green) in dorsal view. EECs are labeled in orange. (c) A tilted view of the figure in (b). (d) A composite chart of the trajectories of EECs in the left primordium, decomposed along 3 mutually orthogonal axes, namely, the anterior-posterior (A-P), the medial-lateral (M-L), and the dorsal-ventral (D-V) axes. The timing of en > RFP and CD-GFP expression and the corresponding developmental stages are marked on top. (e) The schematic diagrams showing the locations, the orientations, and the ranges associated with the corresponding diagrams in (d) and (f). Diagrams ① and ② represent an embryo in the dorsal view while diagram ③ shows the corresponding lateral view. (f) A similar chart as (d) for the right primordium. (g–n) The dorsal views of EADP cells movement from embryonic stage 13 to stage 16. The observation time points (Ob. Time, listed on the top of the corresponding figures) of the images from (g–n) are 0, 12, 78, 126, 138, 162, 234, and 276 min, respectively. (g’–n’) The lateral view of the left primordium corresponding to figures (g–n). The corresponding phase (Ph.) and the equivalent embryonic stage (St.) are listed next to the observation time. The dorsal ridge and the first thoracic segment are indicated by “ → ” and “▸”, respectively. Their posterior boundaries are indicated by dotted lines. In frames (m,m’), (n,n’), the dorsal ridge has involuted inside the embryo so that only the posterior boundaries of the first thoracic segment are visible. Grid size in the background is 20 μm in (b,c). Scale bars are 10 μm in frames (n) and (n’). Frames (g–n) and (g’–n’) are in the same scale.

