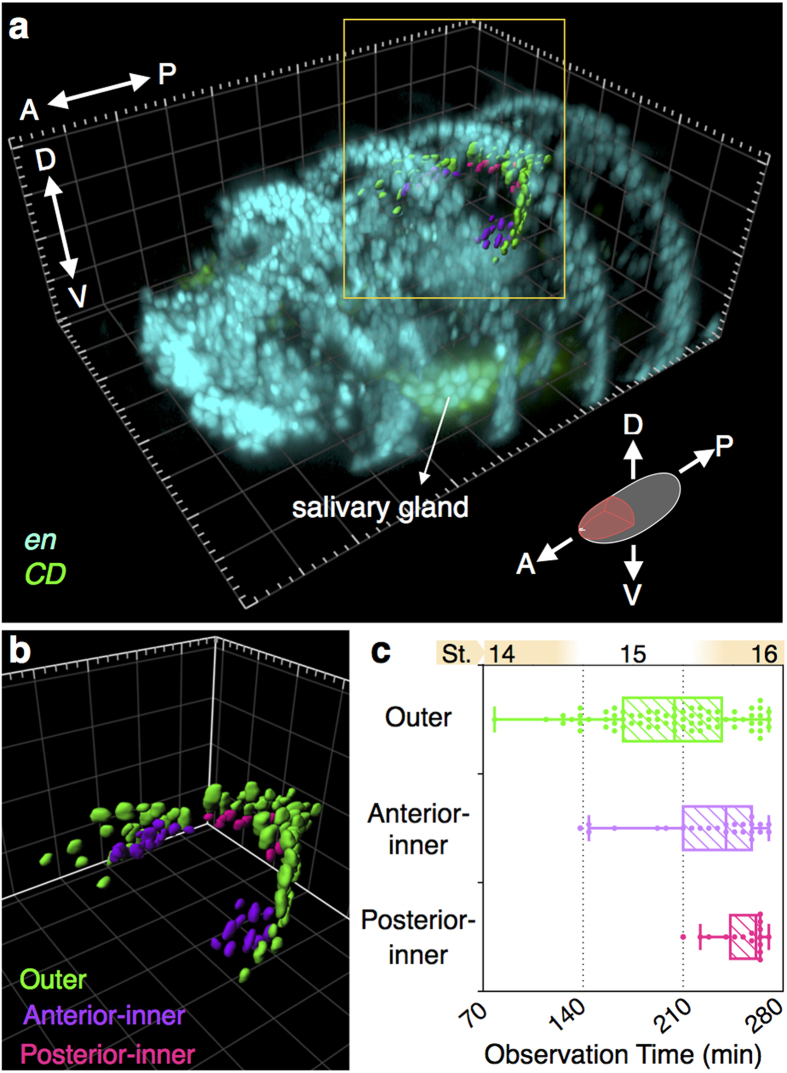
Figure 3. The spatiotemporal relationship of CD expression in the EADP.
(a) A 3D volume rendering of an en > RFP (cyan) and CD-GFP (green) co-expressing embryo from a tilted view at stage 16. The orientation and the imaging area of the data is displayed as the pink region in the schematic embryo. CD+ EADP cells are shown in 3D surface rendering and categorized into outer, anterior-inner, and posterior-inner groups, which are color-coded in green, purple, and pink, respectively. Some ventral en+ CD+ cells belonged to the salivary gland. (b) An enlarged version of the EADP without showing the en- and CD-expression patterns. (c) The distribution of the onset of CD expression of EADP cells. The data points outside the whiskers are regarded as outliers. Grid size in the background in (a) and (b) is 20 μm. Abbreviation: A, anterior; D, dorsal; St., embryonic stage.

