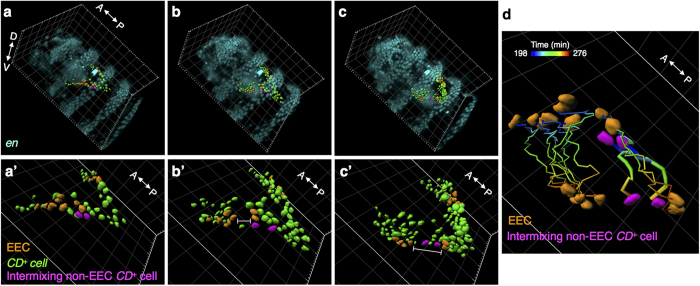
Figure 4. The cell intermixing in EECs during the EADP formation.
(a–c) The 3D volume rendering of fluorescence signals from an en > RFP CD-GFP co-expressing embryo at observation time 198, 240, and 276 min in tilted view. The corresponding embryonic stage was about stage 16. To highlight the EADP, CD+ EADP cells are shown in surface rendering. The dataset is the same as in Fig. 2. (a’–c’) Enlargements of CD+ EADP cells in (a–c), respectively; CD+ EECs are shown in orange, and CD+ cells are shown in green. Two intermixing non-EEC CD+ cells are highlighted in magenta in the left primordium. Gaps between EECs in the left primordium are indicated by the white I-bars in (b’) and (c’). (d) The trajectories of EECs and two intermixing cells from time points 198 to 276 min. The temporal sequence of each trajectory is color-coded. The surface renderings of EECs and the intermixing non-EEC CD+ cells, are labeled in orange and magenta, respectively, at both the starting point and the end point. The trajectories of intermixing non-EEC CD+ cells are highlighted in thicker lines. Grid size in the background of all frames is 20 μm.

