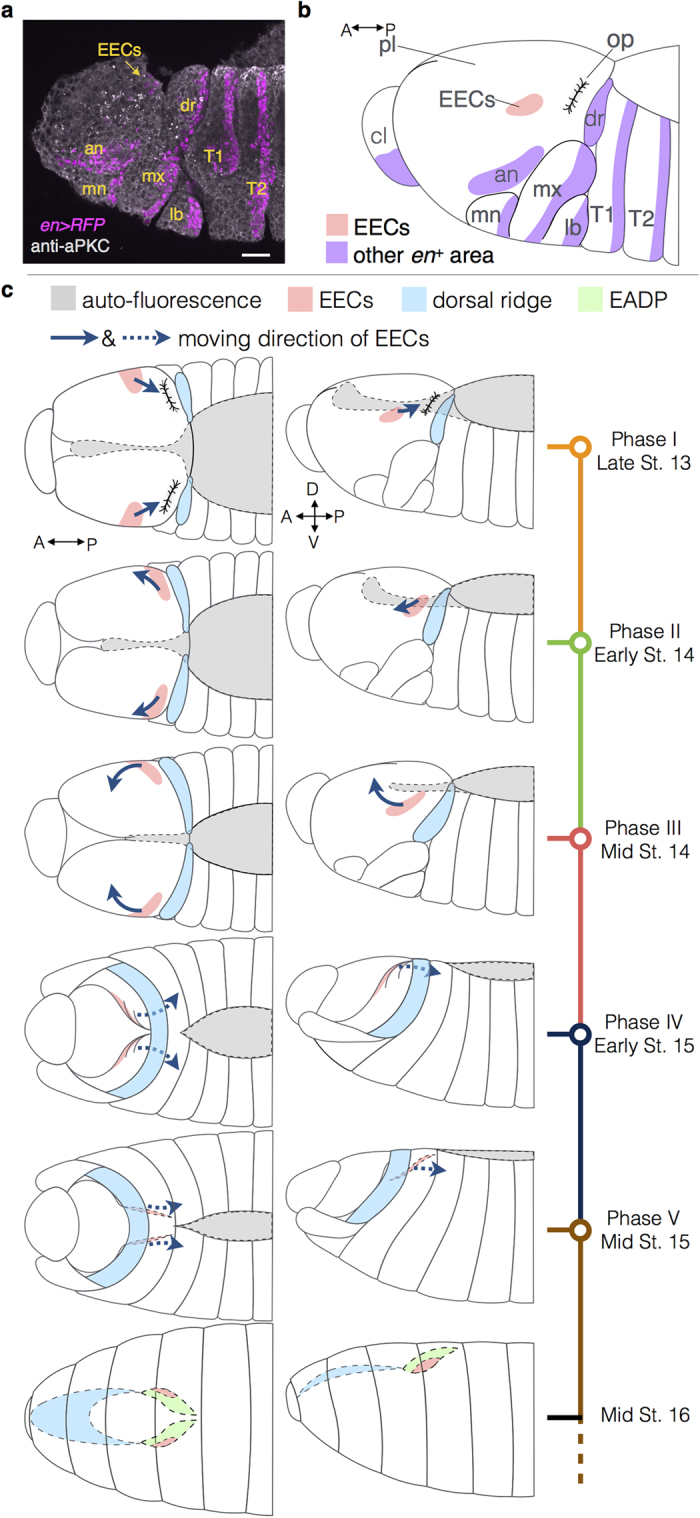
Figure 5. A schematic summary of the location and migration pattern of EECs.

(a) The en expression pattern in lateral view in late stage 13. Scale bar: 20 μm. (b) A schematic diagram of the en expression pattern in (a). EECs and several landmarks, including other en+ sections in procephalic ectoderm (highlighted in purple) and the invagination of optic lobe, are indicated. EECs localize anteriorly adjacent to the optic lobe without connections to other en+ areas. (c) Migration patterns of EECs and the dorsal ridge in different phases in dorsal (left column) and lateral (right column) views. The corresponding embryonic stages are listed below the phase in timeline labels. Solid arrowed lines indicate the direction of EECs’ movement along the surface of the procephalic lobe, whereas the dashed arrowed lines indicate the EECs’ movement in the interior of the embryo, as well as their subsequent interior movement to form part of the EADP (highlighted in green and marked with dashed borders). The areas shaded in gray represent the auto-fluorescence in the amnioserosa and serve as a reference of the embryo morphogenesis in different stages. Anterior is to the left in all figures. Abbreviation: St., embryonic stage, pl, procephalic lobe; op, optic lobe; dr, dorsal ridge; an, antennal; cl, clypeolabral; mn, mandibular; mx, maxillary; lb, labial; T1, the first thoracic segment; T2, the second thoracic segment.
