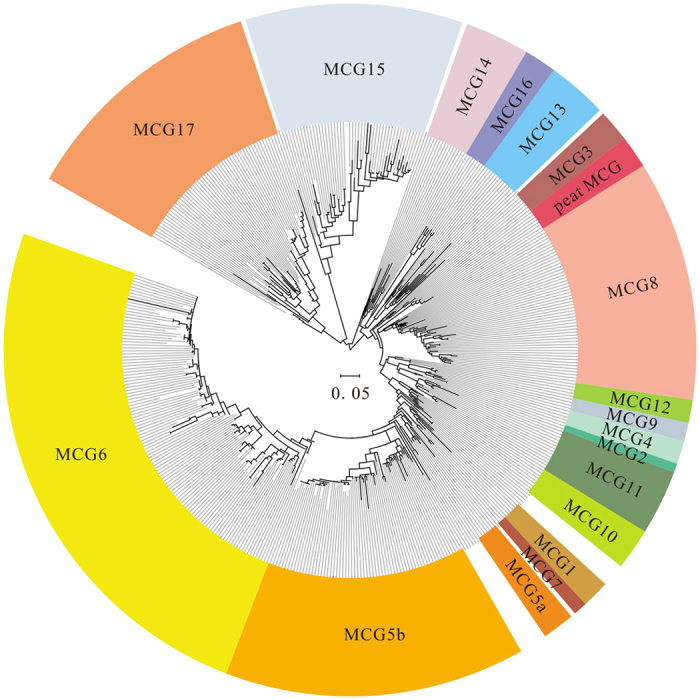
Figure 3. Phylogenetic tree of MCG 16S rRNA genes from different environments was constructed by Maximum Likelihood method under the optimal GTR + G mode.

The scale bar represented 5% estimated sequence divergence. The colored leaves presented different MCG subgroups, and uncolored leaves showed unclassified sequences.
