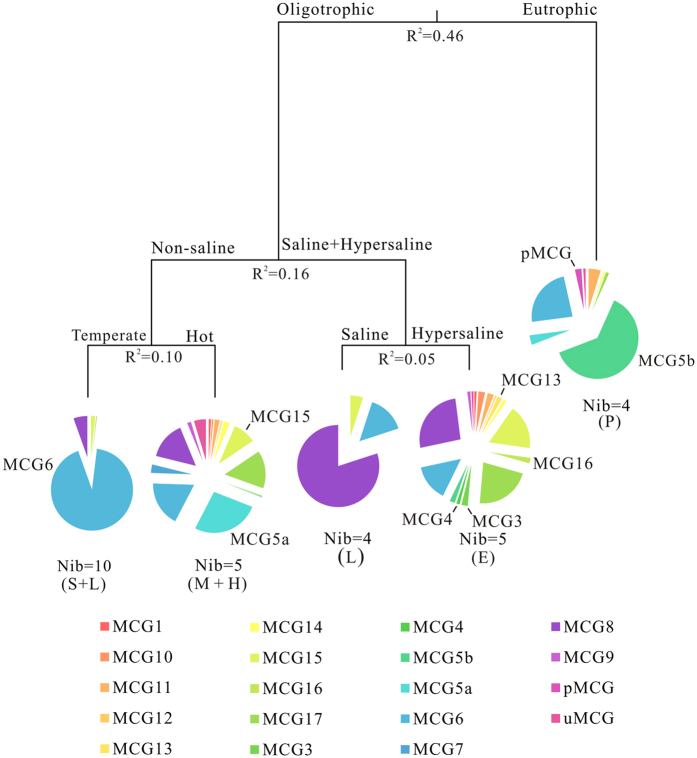
Figure 5. Multivariate regression tree analysis of correlation between MCG subgroups and environmental factors.
The pie charts indicated composition and relative abundance of each MCG subgroup in each leaf. Letters in parenthesis displayed habitat types for each leaf: P: peatland; E: estuary; L: lagoon; S: soil; M: mangrove; H: hot spring; Nib: number of libraries or studying sites.

