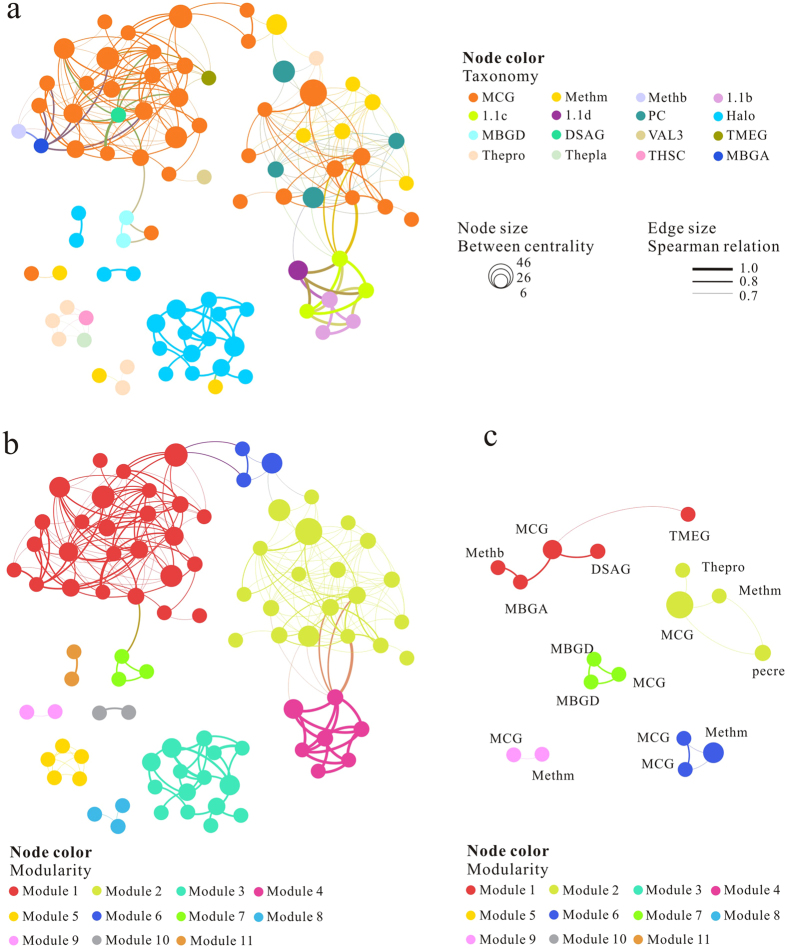
Figure 6. Network analysis of archaeal OTUs in terrestrial settings based on Spearman correlation.
Nodes represented archaeal OTUs (90% cutoff) and the node size is proportional to between centrality. Edges between nodes showed significant (P < 0.01) Spearman correlation. (a) Nodes were colored by archaeal taxonomy, (b) Same network as a, but the node was dyed according to modularity. (c) Sub-network of OTU clustering by modularity, only sub-network related with MCG were presented.

