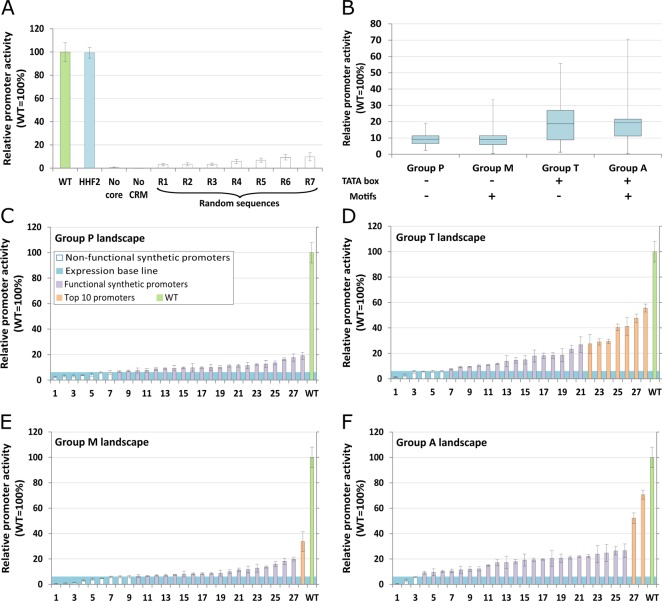
Figure 2.
Establishing the PAOX1-R screening system (A) and testing the 112 synthetic core promoters (B–F). Promoter activity was measured by fluorescence intensity of the reporter protein after cultivation in 96-well deep-well plates and under methanol induction for 48h. (A) Promoter activity mean and respective standard deviation of control constructs: (i) wild type PAOX1 (green), (ii) PAOX1-R fused to HHF2 core promoter, (iii) PAOX1-R without core promoter, (iv) AOX1 core promoter without CRM and (v) seven completely random sequences fused to PAOX1-R. (B) Overview of the groups of synthetic core promoters tested. Box plot of the minimum, first quartile, average, third quartile and maximum promoter activities for each of the four groups of synthetic core promoters (Groups P, M, T and A). (C–F) Landscape of mean promoter activity, and respective standard deviation, for each of the four groups of synthetic core promoters (Group P, T, M and A, respectively). The individual synthetic core promoter activity is presented in increasing activity order. The legend of panel C applies as well to panels D−F. Mean values and standard deviations shown in this figure were calculated from at least three independent cultivations in separate deep-well plates.

