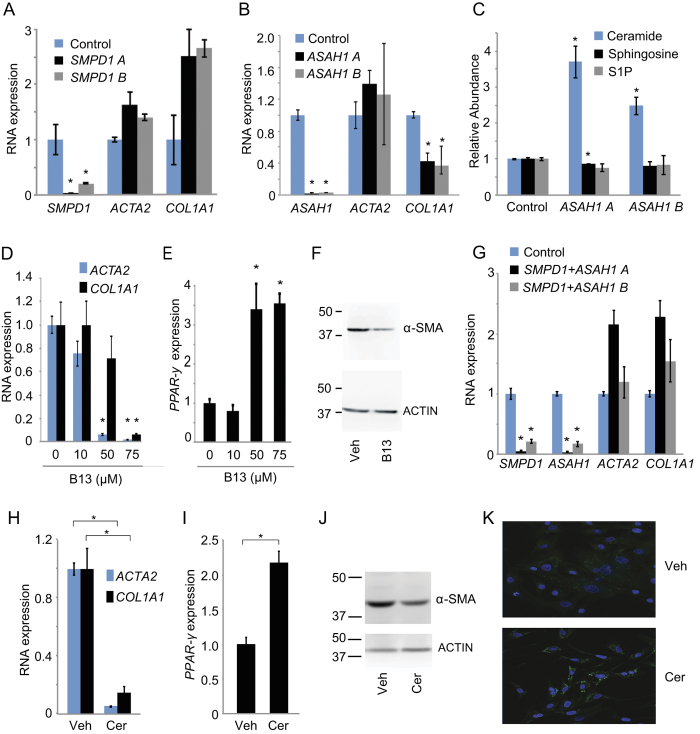
Figure 5. Ceramide regulates collagen expression.
(A and B) qRT-PCR was performed to quantify expression of the indicated genes after transfection with nontargeting siRNA (control) and siRNAs targeting aSMase mRNA (SMPD1) and aCDase mRNA (ASAH1). Two siRNAs (A and B) were used for each mRNA. Samples were normalized using GAPDH. *p < 0.05. (C) Ceramide, sphingosine, and sphingosine 1-phosphate (S1P) were measured in HSCs transfected with a nontargeting siRNA (control) or siRNAs targeting aCDase mRNA (ASAH1). Metabolite levels are shown relative to siRNA controls, which were set to 1. *p < 0.05. (D and E) qRT-PCR was performed to quantify expression of the indicated genes after treatment with ethanol vehicle and B13 at the indicated concentrations. (F) α-SMA expression was quantified by Western blot from HSCs treated with ethanol vehicle (Veh) or B13 (75 μM). ACTIN is shown as a loading control. Molecular weight markers in kilodaltons (kD) are shown on the left of each blot. Cropped gel images are shown. (G) qRT-PCR was performed to quantify expression of the indicated genes after transfection with nontargeting siRNA (control) and siRNAs targeting aSMase mRNA (SMPD1) and aCDase mRNA (ASAH1) in combination. Two siRNAs (A and B) were used for each mRNA. Samples were normalized using GAPDH. *p < 0.05. (H and I) qRT-PCR was performed to quantify expression of the indicated genes after treatment with ethanol vehicle and ceramide-C6 (25 μM). Samples were normalized using GAPDH. *p < 0.05. (J) α-SMA expression was quantified by Western blot from HSCs treated with ethanol vehicle (Veh) or ceramide-C6 (25 μM). ACTIN is shown as a loading control. Molecular weight markers in kilodaltons (kD) are shown on the left of each blot. Cropped gel images are shown. (K) Lipid accumulation was assessed in HSCs treated with ethanol vehicle or ceramide-C6 (25 μM) for 48 hours. Cells were stained with Bodipy (green) and Hoescht (blue).

