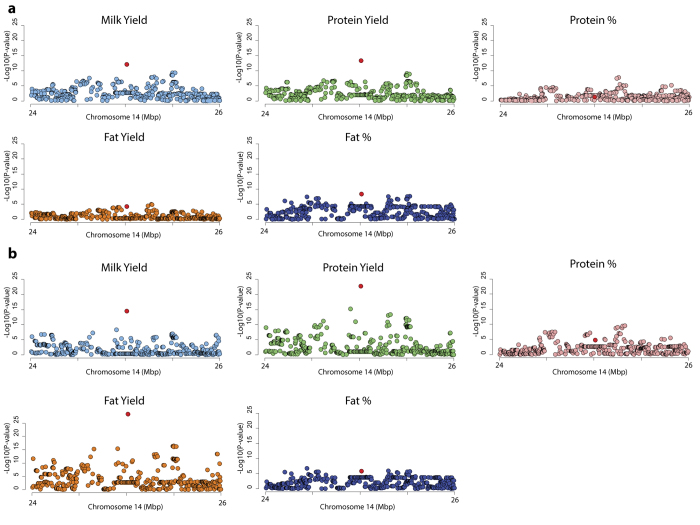
Figure 2. Milk composition QTLs at the chromosome 14 locus.
(a) represents the Manhattan plots for the five milk composition and yield phenotypes, with the X-axis showing Mbp position on chromosome 14, and the Y-axis showing −log10 P-values of marker association. (b) represents similar plots where animal body weight has been fitted as an additional covariate in otherwise identical association models. The rs109815800 SNP is coloured red in both (a) and (b).

