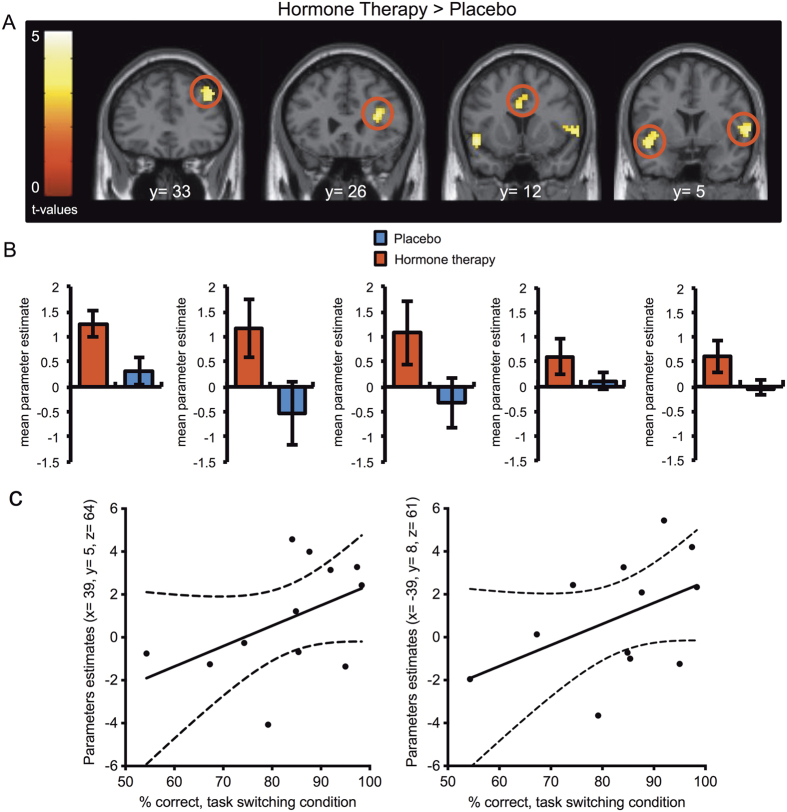
Figure 4.
Direct comparison between HT and placebo during task switching relative to control. (A) Significantly greater activation after HT administration compared with placebo during task switching blocks relative to control (Display threshold, p < 0.005, uncorrected). The activation maps are overlaid on coronal sections of a structural template MRI. The color bars represent t values. (B) Mean and SEM of the contrast values in functional clusters of interest during task switching condition when comparing HT and placebo. From left to right, in the right dorsolateral prefrontal cortex, the right ventro-lateral prefrontal cortex, the anterior cingulate cortex and the inferior frontal junction/anterior insula. (C) Positive correlation between % correct performance and parameter estimates in right and left DLPFC in the task switching > control conditions in women under HT.

