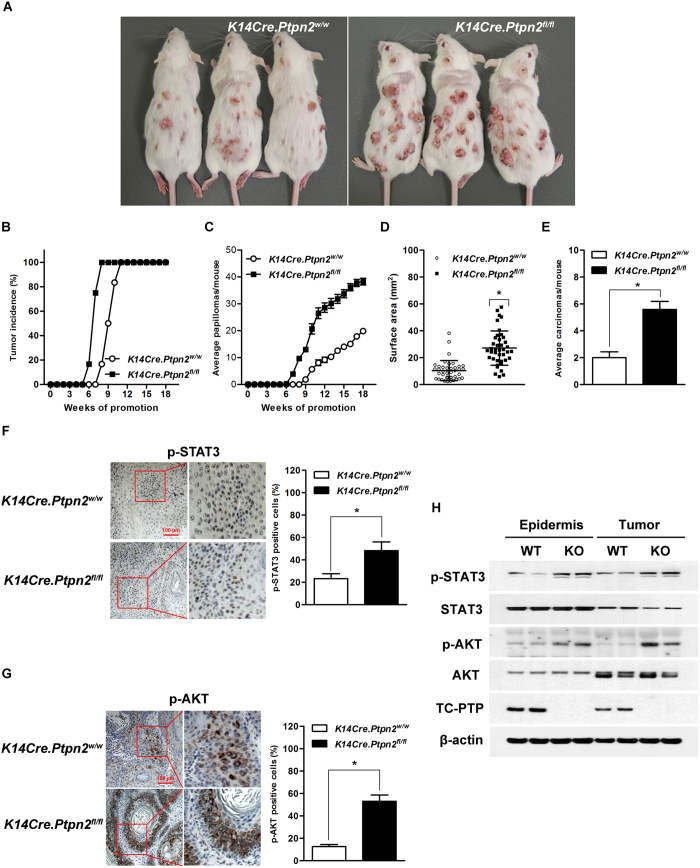
Figure 7. Effect of TC-PTP disruption in the epidermis during two-stage skin carcinogenesis.
Groups of K14Cre.Ptpn2fl/fl and K14Cre.Ptpn2w/w mice (n = 12) were treated with 25 nmol DMBA and after 2 weeks treated with twice-weekly application of 6.8 nmol of TPA for the duration of the experiment. (A) Representative photograph of K14Cre.Ptpn2w/w and K14Cre.Ptpn2fl/fl mice at the 18th week of tumor promotion. (B) Percentage of mice with tumors. (C) Average number of tumors per mouse. (mean ± s.e.m.). (D) Tumor size. The surface area of tumors was measured at the 18th week of tumor promotion. *p < 0.05 by Mann-Whitney U test. (E) Average carcinomas per mouse. (mean ± s.e.m.). *p < 0.05 by Mann-Whitney U test. (F–G) Representative immunohistochemical staining of p-STAT3, and p-AKT in papillomas from both genotypes. The values are represented as a mean ± s.d.m. (n = 5). *p < 0.05 by Mann-Whitney U test. Scale bar: 100 μm. (F) p-STAT3 staining. Right, quantitative analysis of percentage of p-STAT3-positive cells in papillomas. (G) p-AKT staining. Right, quantitative analysis of percentage of p-STAT3-positive cells in papillomas. (H) Expression of p-STAT3 and p-AKT in the epidermis and papillomas from both genotypes. Epidermal cell lysates were isolated from both genotypes (untreated). Five to 10 papillomas were collected and pooled at the end of the study to generate protein lysates.

